pacman::p_load(tidyverse, ggstatsplot, ExPanDaR)Prototype - Confirmatory Data Analysis
1 Load Packages
We will load the following R packages for this exercise:
2 Load Data
The data used in this exercise are obtained from the Meteorological Service Singapore Website. To better align the outputs of the individual assignment to the project, my team has standardised the data cleaning steps on our project website. As the cleaned data sets were saved as RDS files, we will load them using read_rds() for this exercise.
2.1. Load temperature data
temp_monthly <- read_rds("data/temp_monthly.rds")
glimpse(temp_monthly)
Rows: 3,715
Columns: 9
$ Station <chr> "Admiralty", "Admiralty", "Admiralty", "Admiralty", "Adm…
$ Region <chr> "North", "North", "North", "North", "North", "North", "N…
$ Year <dbl> 2009, 2009, 2009, 2009, 2009, 2009, 2009, 2009, 2009, 20…
$ Month <ord> Jan, Feb, Mar, Apr, May, Jun, Jul, Aug, Sep, Oct, Nov, D…
$ Avg_Mean_Temp <dbl> 26.3, 26.8, 26.9, 28.1, 28.5, 28.9, 28.1, 28.1, 28.3, 28…
$ Avg_Max_Temp <dbl> 31.9, 33.4, 34.5, 35.1, 34.7, 34.7, 33.7, 33.6, 34.3, 34…
$ Avg_Min_Temp <dbl> 23.3, 23.0, 22.2, 23.7, 21.8, 23.7, 22.5, 22.7, 23.1, 22…
$ Max_Temp <dbl> 31.9, 33.4, 34.5, 35.1, 34.7, 34.7, 33.7, 33.6, 34.3, 34…
$ Min_Temp <dbl> 23.3, 23.0, 22.2, 23.7, 21.8, 23.7, 22.5, 22.7, 23.1, 22…temp_annual <- read_rds("data/temp_annual.rds")
glimpse(temp_annual)Rows: 323
Columns: 8
$ Station <chr> "Admiralty", "Admiralty", "Admiralty", "Admiralty", "Adm…
$ Region <chr> "North", "North", "North", "North", "North", "North", "N…
$ Year <dbl> 2009, 2010, 2011, 2012, 2013, 2014, 2015, 2016, 2017, 20…
$ Avg_Mean_Temp <dbl> 27.6, 27.8, 27.3, 27.4, 27.5, 27.6, 27.9, 28.1, 27.7, 27…
$ Avg_Max_Temp <dbl> 34.0, 34.7, 33.9, 33.9, 34.3, 34.0, 34.1, 34.4, 34.4, 34…
$ Avg_Min_Temp <dbl> 22.9, 22.4, 22.3, 22.5, 22.6, 22.8, 23.0, 22.9, 22.9, 22…
$ Max_Temp <dbl> 35.1, 36.6, 35.5, 34.7, 36.2, 35.8, 35.1, 36.3, 35.3, 35…
$ Min_Temp <dbl> 21.8, 21.3, 21.2, 21.6, 21.7, 21.8, 22.2, 21.9, 22.1, 21…2.2. Load rainfall data
rf_monthly <- read_rds("data/rf_monthly.rds")
glimpse(rf_monthly)
Rows: 5,547
Columns: 14
$ Station <chr> "Admiralty", "Admiralty", "Admiralty", "Admiralty", "A…
$ Region <chr> "North", "North", "North", "North", "North", "North", …
$ Year <dbl> 2009, 2009, 2009, 2009, 2009, 2009, 2009, 2009, 2009, …
$ Month <ord> Jan, Feb, Mar, Apr, May, Jun, Jul, Aug, Sep, Oct, Nov,…
$ Total_Rf <dbl> 0.8, 148.0, 348.0, 148.8, 205.6, 92.0, 103.0, 90.2, 67…
$ Total_Rf_30 <dbl> 0, 0, 0, 0, 0, 0, 0, 0, 0, 0, 0, 0, 0, 0, 0, 0, 0, 0, …
$ Total_Rf_60 <dbl> 0, 0, 0, 0, 0, 0, 0, 0, 0, 0, 0, 0, 0, 0, 0, 0, 0, 0, …
$ Total_Rf_120 <dbl> 0, 0, 0, 0, 0, 0, 0, 0, 0, 0, 0, 0, 0, 0, 0, 0, 0, 0, …
$ Avg_Total_Rf <dbl> 0.8, 148.0, 348.0, 148.8, 205.6, 92.0, 103.0, 90.2, 67…
$ Avg_Total_Rf30 <dbl> 0, 0, 0, 0, 0, 0, 0, 0, 0, 0, 0, 0, 0, 0, 0, 0, 0, 0, …
$ Avg_Total_Rf60 <dbl> 0, 0, 0, 0, 0, 0, 0, 0, 0, 0, 0, 0, 0, 0, 0, 0, 0, 0, …
$ Avg_Total_Rf120 <dbl> 0, 0, 0, 0, 0, 0, 0, 0, 0, 0, 0, 0, 0, 0, 0, 0, 0, 0, …
$ Min_Total_Rf <dbl> 0.8, 148.0, 348.0, 148.8, 205.6, 92.0, 103.0, 90.2, 67…
$ Max_Total_Rf <dbl> 0.8, 148.0, 348.0, 148.8, 205.6, 92.0, 103.0, 90.2, 67…rf_annual <- read_rds("data/rf_annual.rds")
glimpse(rf_annual)Rows: 469
Columns: 13
$ Station <chr> "Admiralty", "Admiralty", "Admiralty", "Admiralty", "A…
$ Region <chr> "North", "North", "North", "North", "North", "North", …
$ Year <dbl> 2009, 2010, 2011, 2012, 2013, 2014, 2015, 2016, 2017, …
$ Total_Rf <dbl> 1736.6, 2980.8, 2871.8, 2916.8, 2559.8, 1809.3, 2046.8…
$ Total_Rf_30 <dbl> 0.0, 0.0, 0.0, 0.0, 0.0, 1184.8, 1341.4, 1250.4, 1222.…
$ Total_Rf_60 <dbl> 0.0, 0.0, 0.0, 0.0, 0.0, 1434.8, 1636.2, 1546.2, 1471.…
$ Total_Rf_120 <dbl> 0.0, 0.0, 0.0, 0.0, 0.0, 1556.3, 1852.0, 1743.2, 1645.…
$ Avg_Total_Rf <dbl> 144.7, 248.4, 239.3, 243.1, 213.3, 164.5, 170.6, 164.0…
$ Avg_Total_Rf30 <dbl> 0.0, 0.0, 0.0, 0.0, 0.0, 107.7, 111.8, 104.2, 101.8, 1…
$ Avg_Total_Rf60 <dbl> 0.0, 0.0, 0.0, 0.0, 0.0, 130.4, 136.3, 128.8, 122.6, 1…
$ Avg_Total_Rf120 <dbl> 0.0, 0.0, 0.0, 0.0, 0.0, 141.5, 154.3, 145.3, 137.1, 1…
$ Min_Total_Rf <dbl> 0.8, 84.4, 63.8, 105.4, 75.0, 15.8, 62.0, 54.8, 0.0, 7…
$ Max_Total_Rf <dbl> 348.0, 472.6, 455.6, 455.8, 319.0, 301.0, 351.2, 256.6…3. Confirmatory Data Analysis (CDA)
For the purpose of the project, CDA will be conducted to compare the following:
Is there a significant difference in the annual temperature recorded at the selected weather stations or regions?
Is there a significant difference in the monthly temperature recorded at the selected weather stations or regions?
Is there a significant difference in the annual total rainfall recorded at the selected weather stations or regions?
Is there a significant difference in the monthly total rainfall recorded at the selected weather stations or regions?
4. Creating Static Plots
First, we begin by creating a static plots to check the feasibility of each plot. Before we do so, we will create an additional table to hold the aggregated values to be used in the plots.
4.1. Comparing Temperature Without Functions
First, we create a static plot without functions to visualise the output.
ggbetweenstats(data = temp_annual,
               x = Station,
               y = Avg_Max_Temp,
               plot.type = "boxviolin",
               type = "nonparametric",
               pairwise.display = "non-significant",
               messages = FALSE)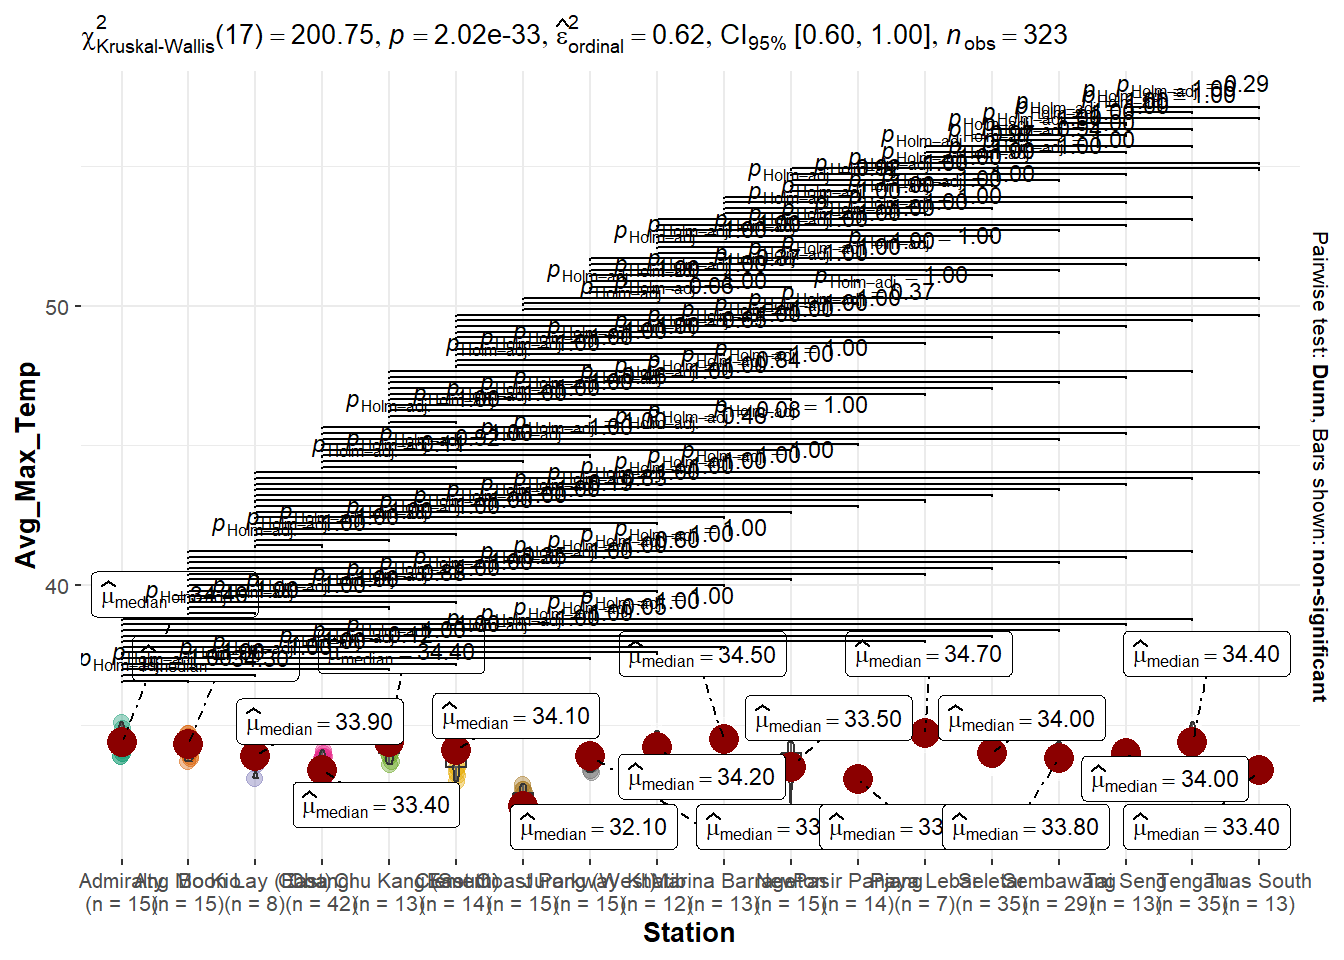
ggbetweenstats(data = temp_monthly,
               x = Region,
               y = Avg_Max_Temp,
               plot.type = "boxviolin",
               type = "nonparametric",
               pairwise.display = "non-significant",
               messages = FALSE)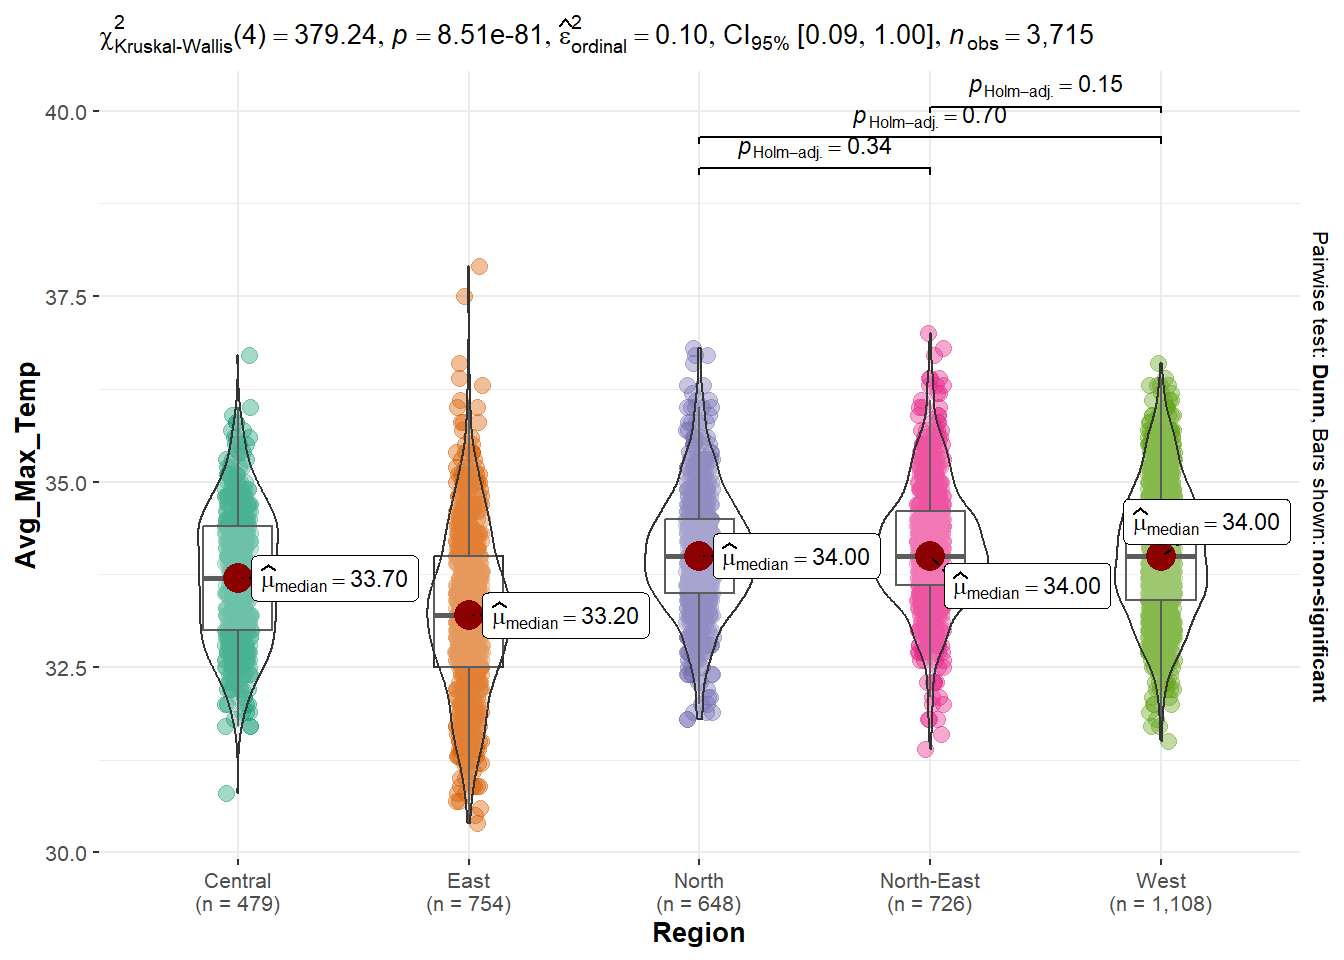
4.3. Comparing Rainfall Without Functions
ggbetweenstats(data = rf_annual,
               x = Station,
               y = Avg_Total_Rf,
               plot.type = "boxviolin",
               type = "nonparametric",
               pairwise.display = "non-significant",
               messages = FALSE)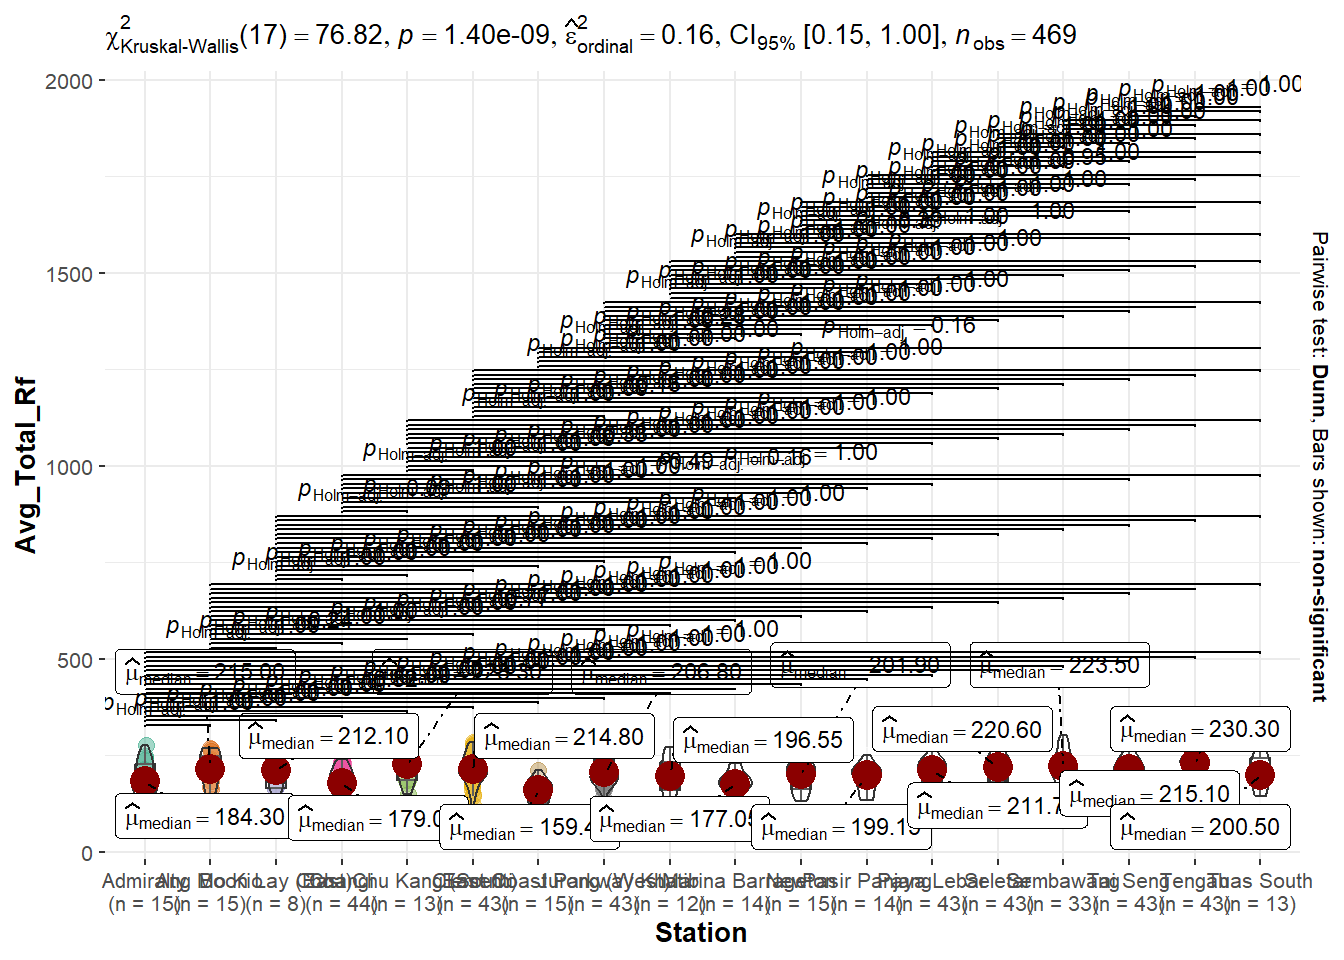
ggbetweenstats(data = rf_monthly,
               x = Region,
               y = Min_Total_Rf,
               plot.type = "boxviolin",
               type = "nonparametric",
               pairwise.display = "non-significant",
               messages = FALSE)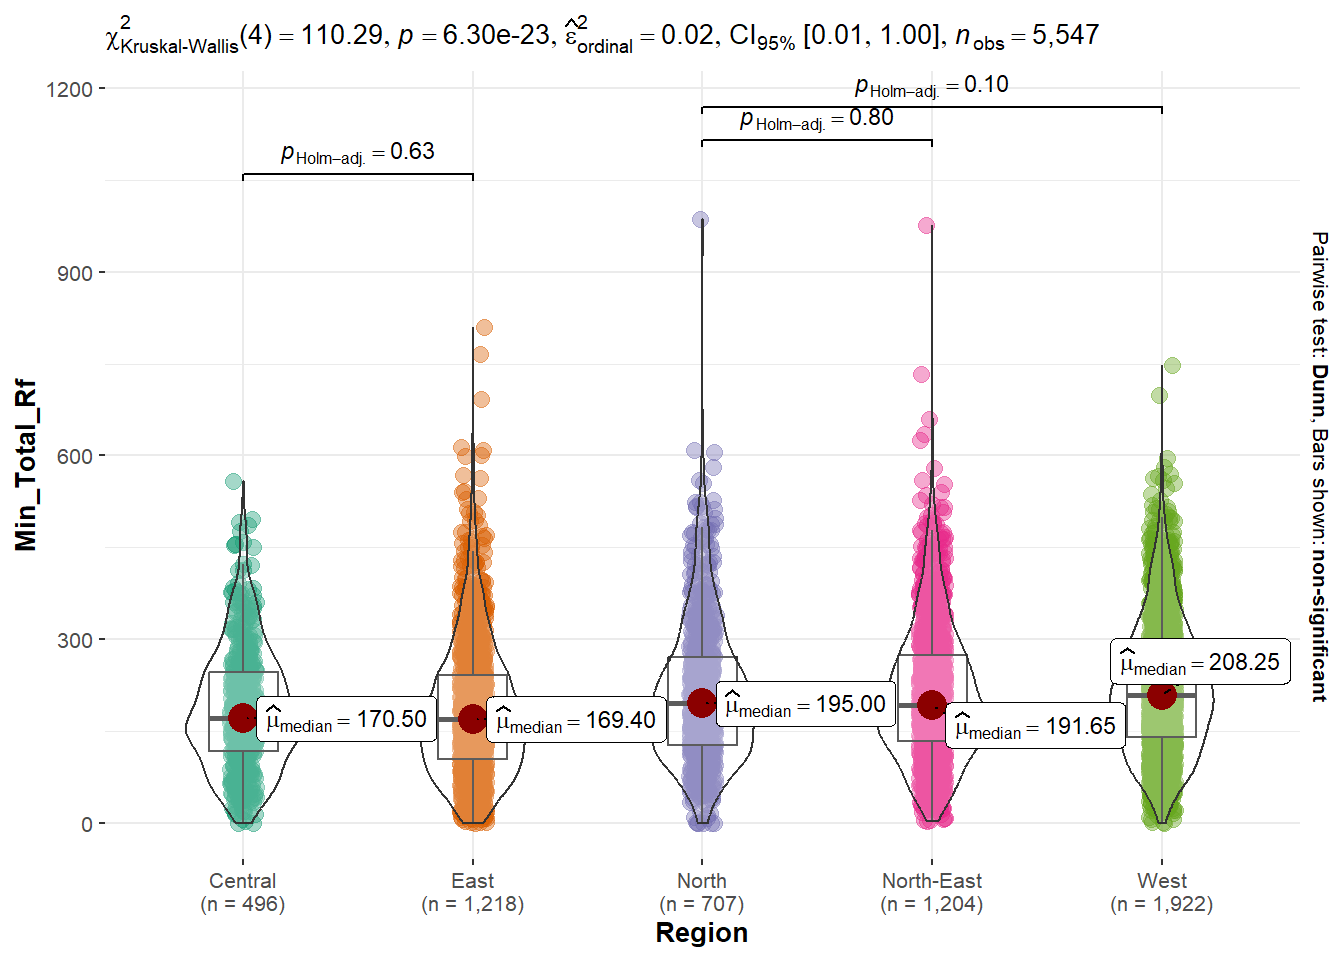
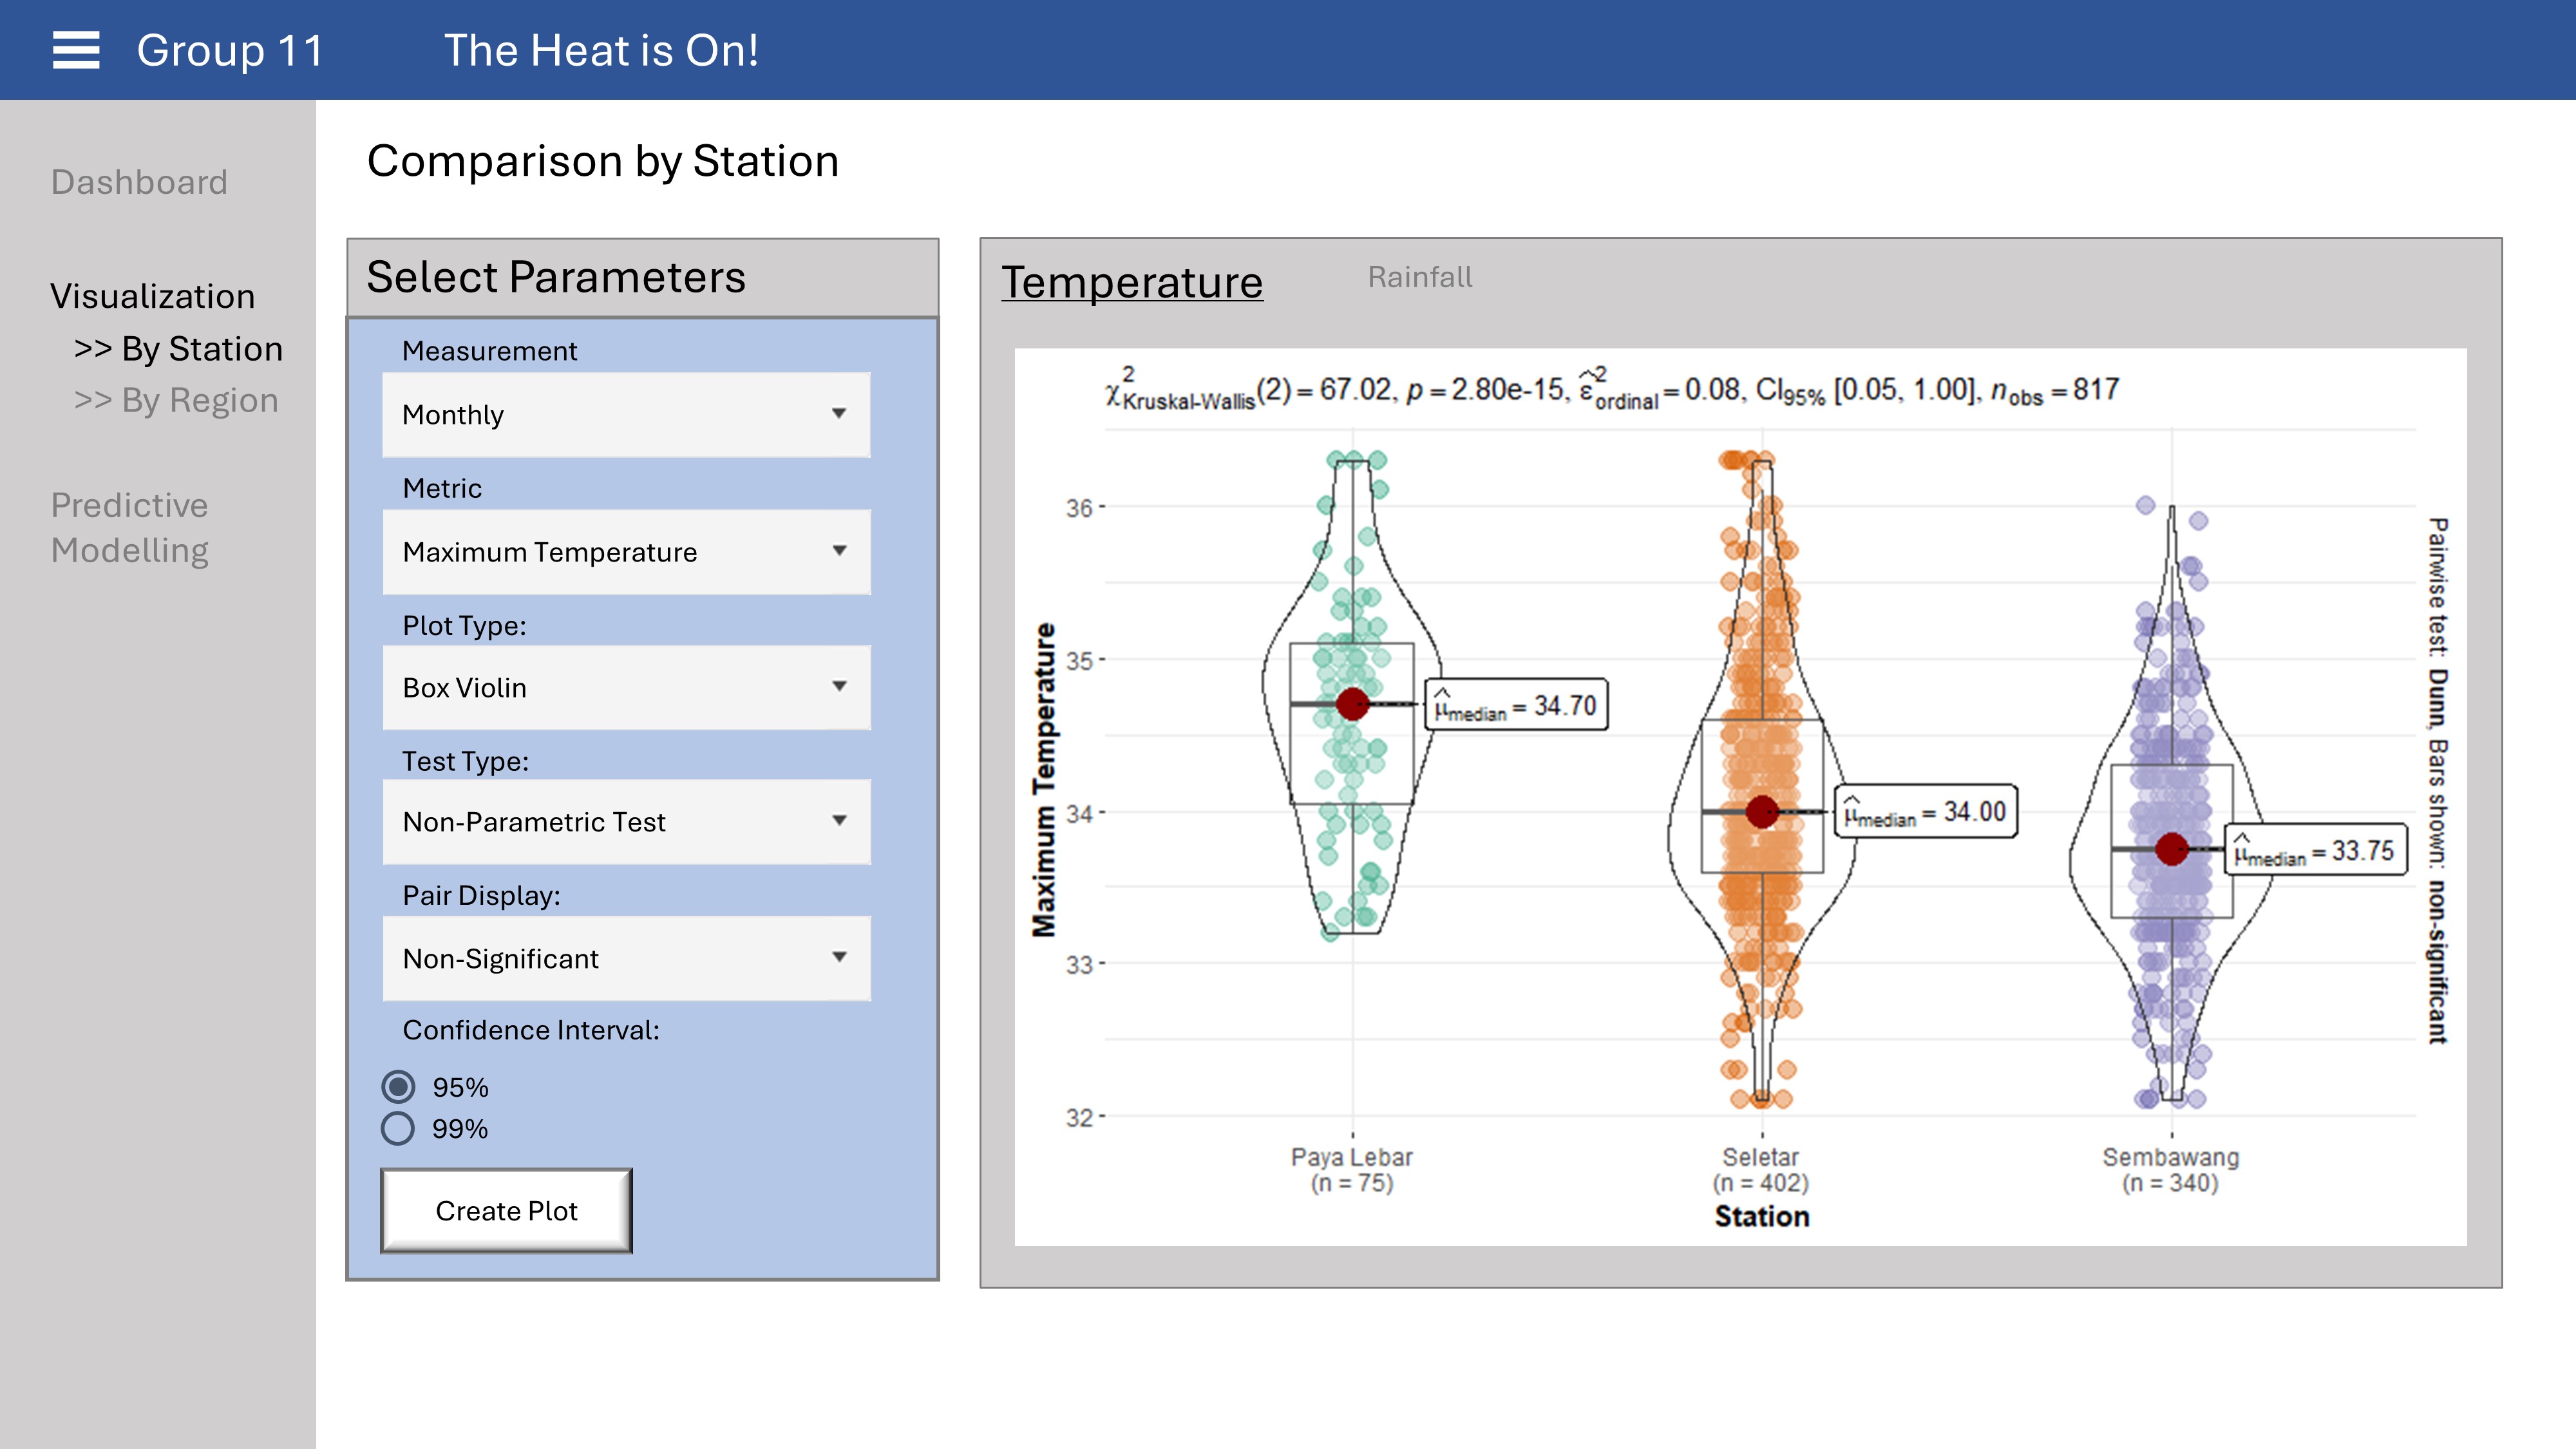
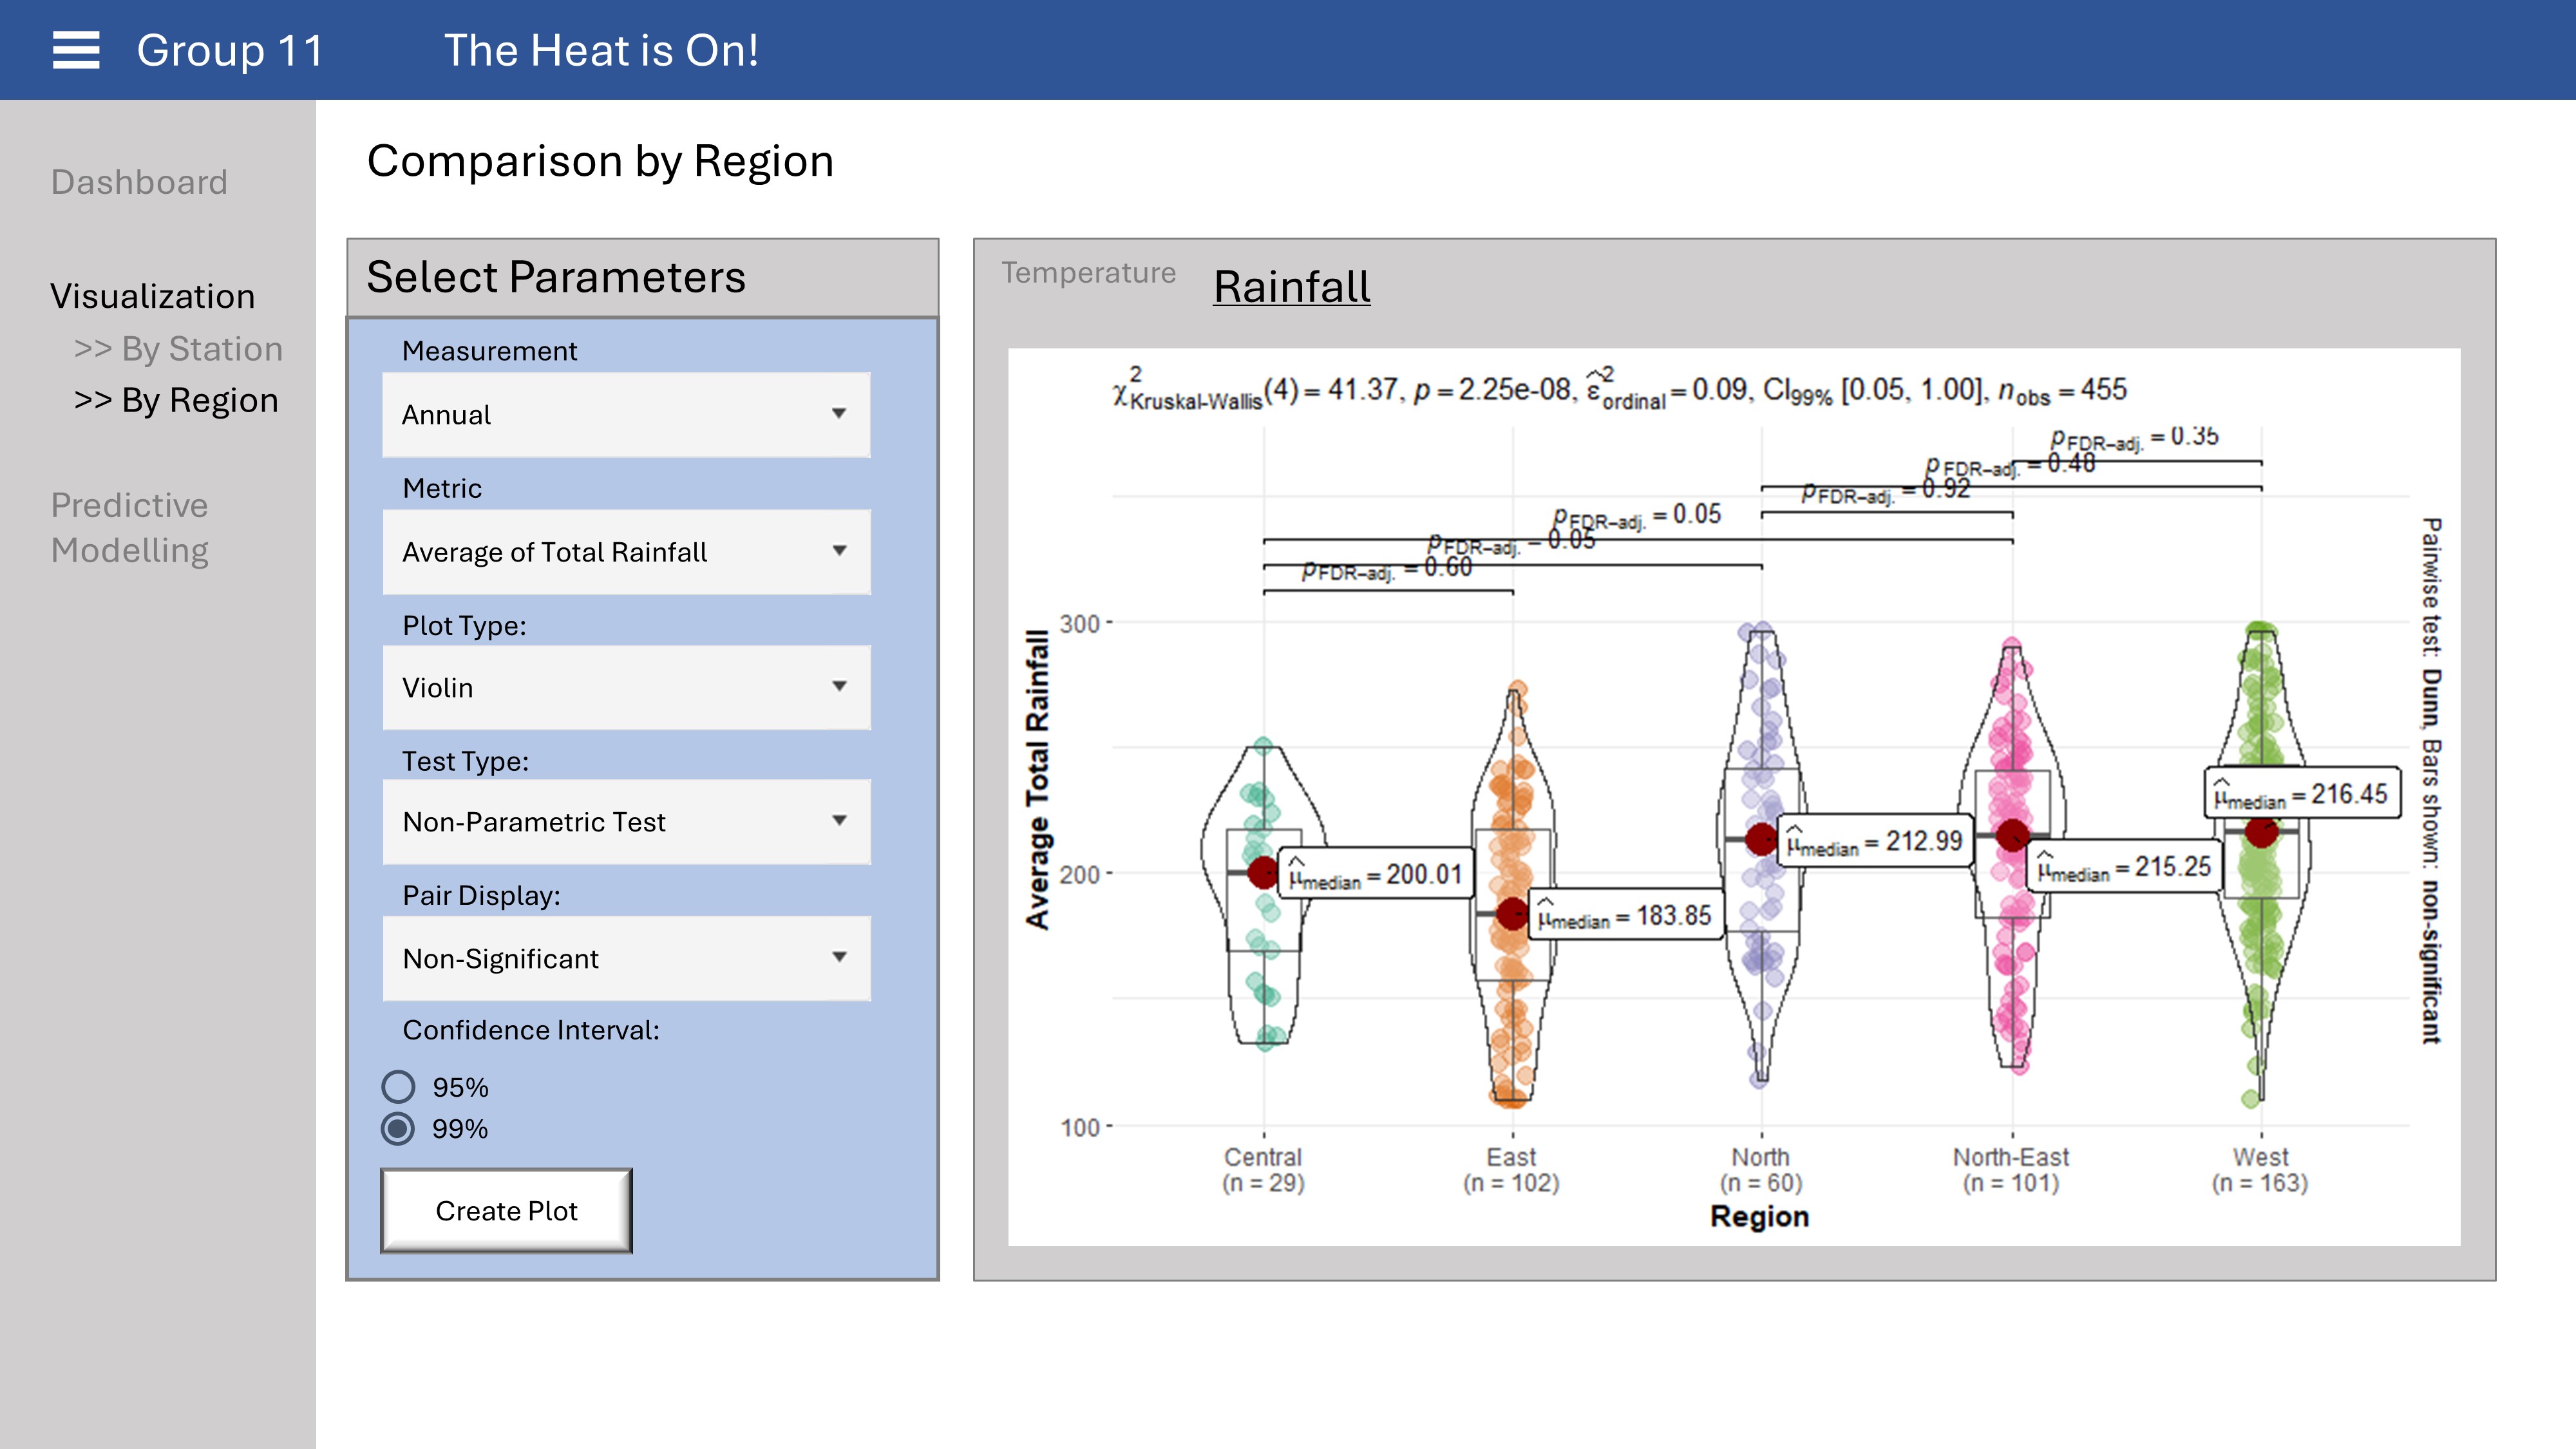
UI Considerations
With the Shiny app in mind, some parameters that can allow user-input in this plot include:
plot.type: acceptsboxviolin,box,violintype: acceptsnonparametric,parametric,robust,bayespairwise.display= acceptssignificant,non-significant,everything,all
5. Compare Annual Temperature
5.1. Create Function - Annual Temperature by Station
From the plots above, it is difficult to compare the chosen metric of all stations at once. Due to the number of stations available, each plot becomes very small and much of the details are lost. We will now attempt to create a function to display only the top3 stations by average annual temperature recorded.
temp_annual_sorted <-  temp_annual %>%
  arrange(desc(Avg_Mean_Temp))

top3 <- temp_annual_sorted$Station[1:3]
Annual_Top3_Temp_Station <- function(metric = "Avg_Mean_Temp",
selected_station,
p_type = "boxviolin",
t_type = "nonparametric",
pair_disp = "non-significant",
pair.comp = T,
conf = 0.95,
nooutliers = T){
metric_label = case_when(metric == "Avg_Mean_Temp" ~ "Average Mean Temperature",
metric == "Avg_Max_Temp" ~ "Average of Max Temperature",
metric == "Avg_Min_Temp" ~ "Average of Minimum Temperature",
metric == "Max_Temp" ~ "Maximum Temperature",
metric == "Min_Temp" ~ "Minimum Temperature",
TRUE ~ metric)
test_label = case_when(t_type == "parametric" ~ "Mean (Parametric)",
t_type == "nonparametric" ~ "Median (Non-Parametric)",
t_type == "robust" ~ "Mean (Robust t-test)",
t_type == "bayes" ~ "Mean (Bayesian)",)
temp_annual_anova <- temp_annual %>%
filter(Station %in% selected_station) %>%
mutate(Station = fct_reorder(Station, !!sym(metric), .desc = TRUE))
if(nooutliers == T){
temp_annual_anova <- temp_annual_anova %>%
treat_outliers()
}
temp_annual_anova %>%
ggbetweenstats(x = Station,
y = !!sym(metric),
plot.type = p_type,
type = t_type,
pairwise.comparisons = T,
pairwise.display = pair_disp,
mean.ci = T,
p.adjust.method = "fdr",
conf.level = conf,
xlab = "Station", ylab = metric_label,)
}Annual_Top3_Temp_Station(metric = "Avg_Mean_Temp",
selected_station = top3,
p_type = "boxviolin",
t_type = "nonparametric",
pair_disp = "non-significant",
pair.comp = T,
conf = 0.95,
nooutliers = T)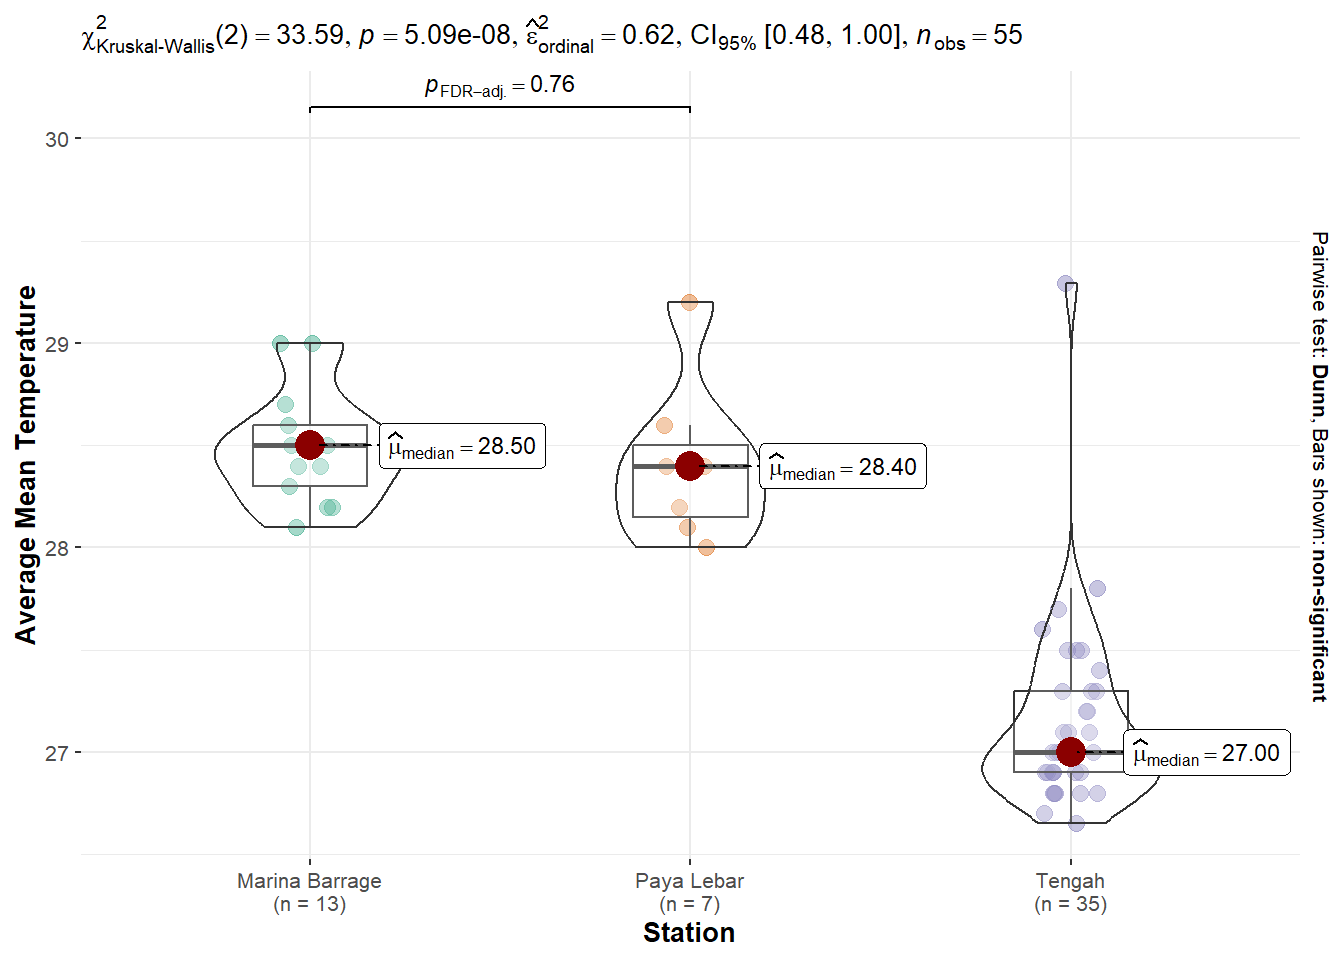
Annual_Top3_Temp_Station(metric = "Max_Temp",
                         selected_station = top3,
                         p_type = "box",
                         t_type = "nonparametric",
                         pair_disp = "non-significant",
                         pair.comp = T,
                         conf = 0.95,
                         nooutliers = T)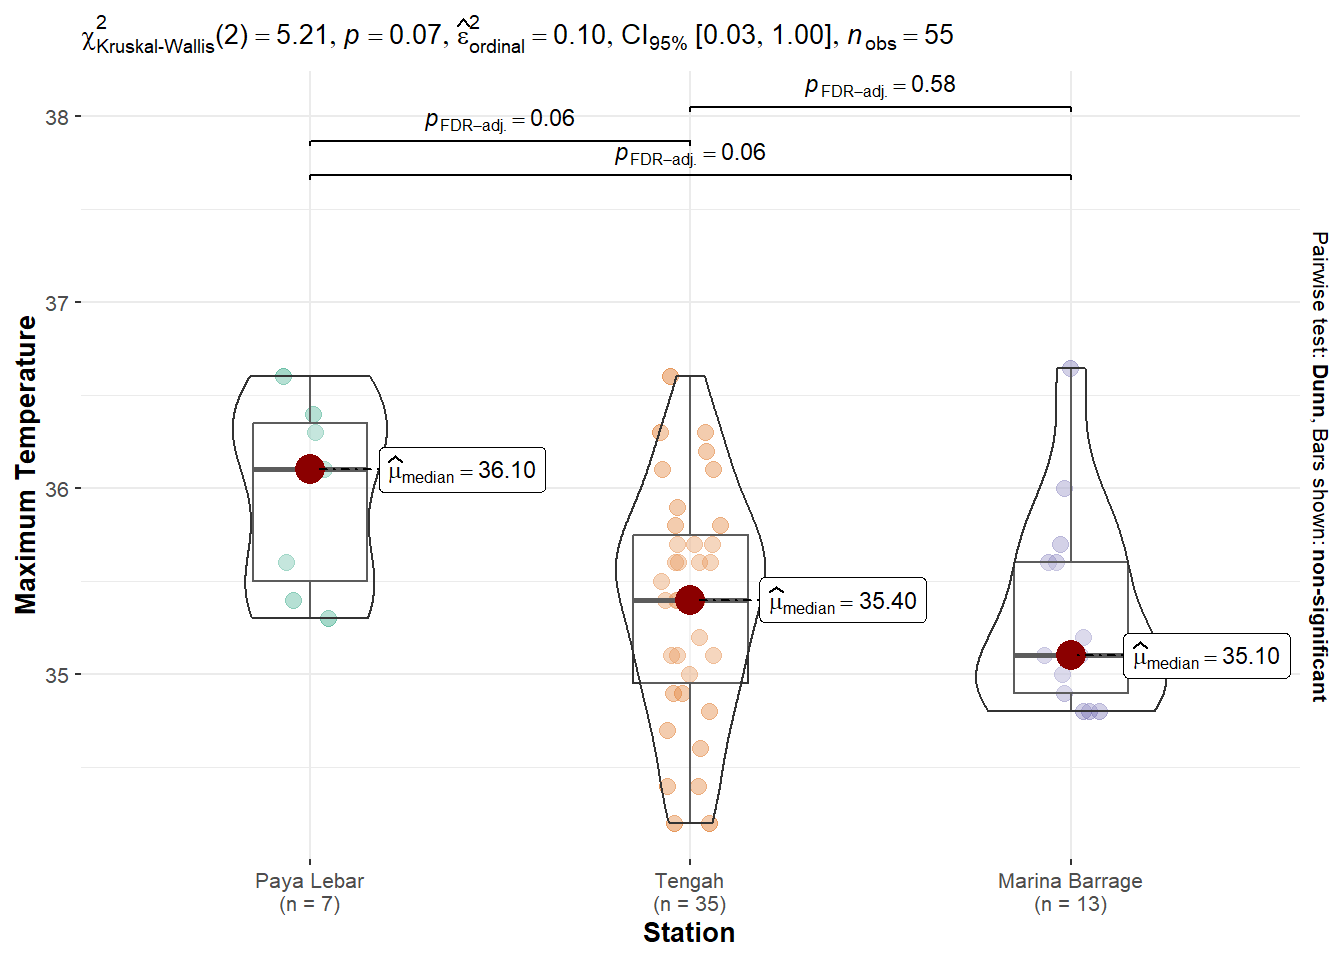
Annual_Top3_Temp_Station(metric = "Avg_Min_Temp",
                         selected_station = top3,
                         p_type = "violin",
                         t_type = "nonparametric",
                         pair_disp = "non-significant",
                         pair.comp = T,
                         conf = 0.99,
                         nooutliers = T)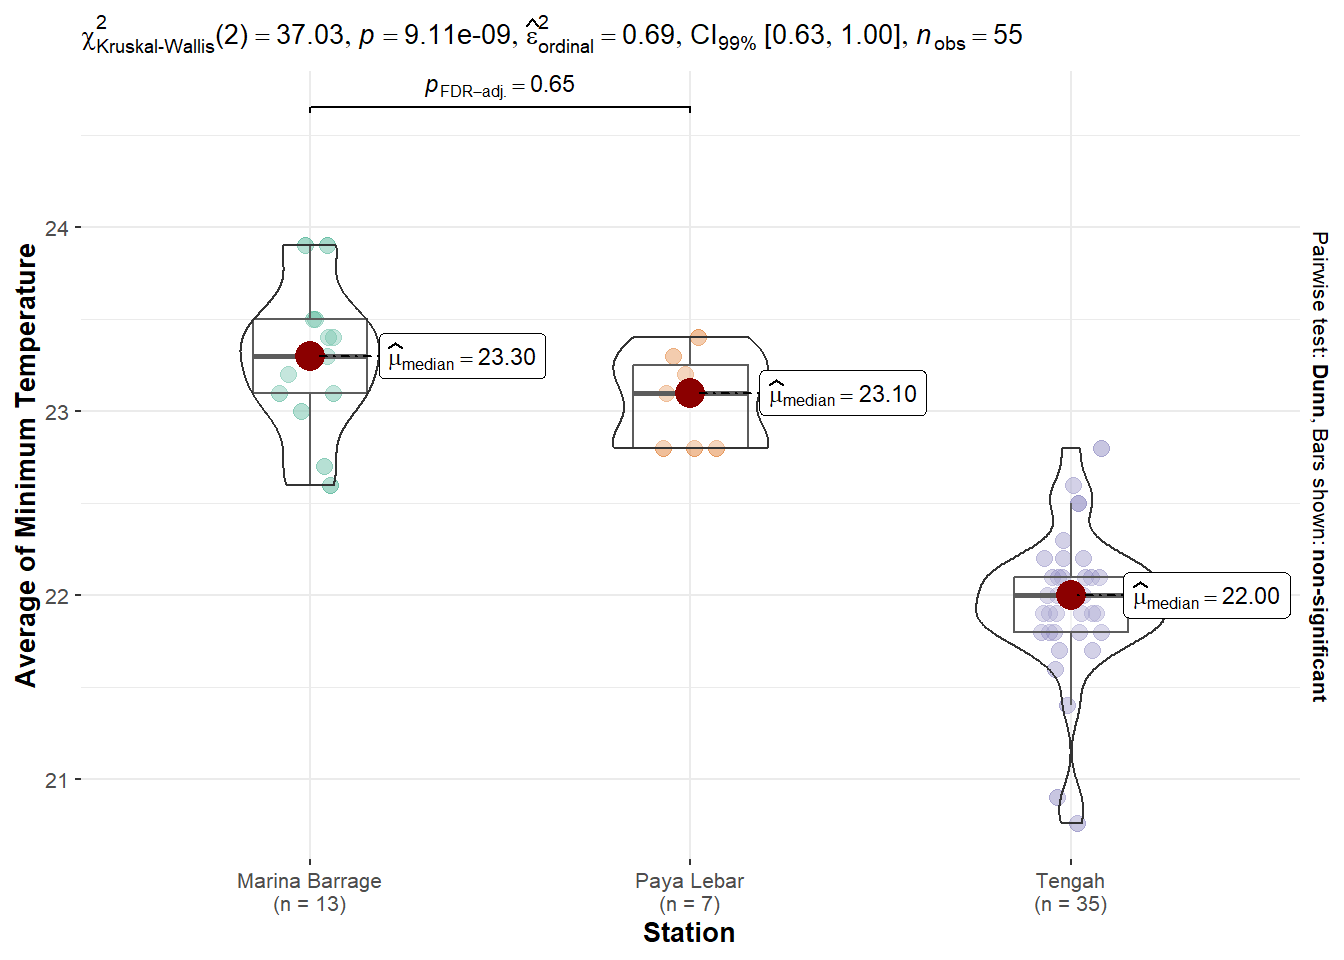
5.2. Create Function - Annual temperature by Region
Annual_Temp_Region <- function(metric = "Avg_Mean_Temp",
                               p_type = "boxviolin",
                               t_type = "nonparametric",
                               pair_disp = "non-significant",
                               pair.comp = T,
                               conf = 0.95,
                               nooutliers = T){

  metric_label = case_when(metric == "Avg_Mean_Temp" ~ "Average Mean Temperature",
                           metric == "Avg_Max_Temp" ~ "Average of Max Temperature",
                           metric == "Avg_Min_Temp" ~ "Average of Minimum Temperature",
                           metric == "Max_Temp" ~ "Maximum Temperature",
                           metric == "Min_Temp" ~ "Minimum Temperature",
                           TRUE ~ metric)

  test_label = case_when(t_type == "parametric" ~ "Mean (Parametric)",
                         t_type == "nonparametric" ~ "Median (Non-Parametric)",
                         t_type == "robust" ~ "Mean (Robust t-test)",
                         t_type == "bayes" ~ "Mean (Bayesian)",)

  if(nooutliers == T){
  temp_annual <- temp_annual %>%
      treat_outliers()
  }

  temp_annual %>%
    ggbetweenstats(x = Region,
                   y = !!sym(metric),
                   plot.type = p_type,
                   type = t_type,
                   pairwise.comparisons = T,
                   pairwise.display = pair_disp,
                   mean.ci = T,
                   p.adjust.method = "fdr",
                   conf.level = conf,
                   xlab = "Region", ylab = metric_label,)
}Annual_Temp_Region(metric = "Avg_Mean_Temp",
p_type = "boxviolin",
t_type = "nonparametric",
pair_disp = "non-significant",
pair.comp = T,
conf = 0.95,
nooutliers = T)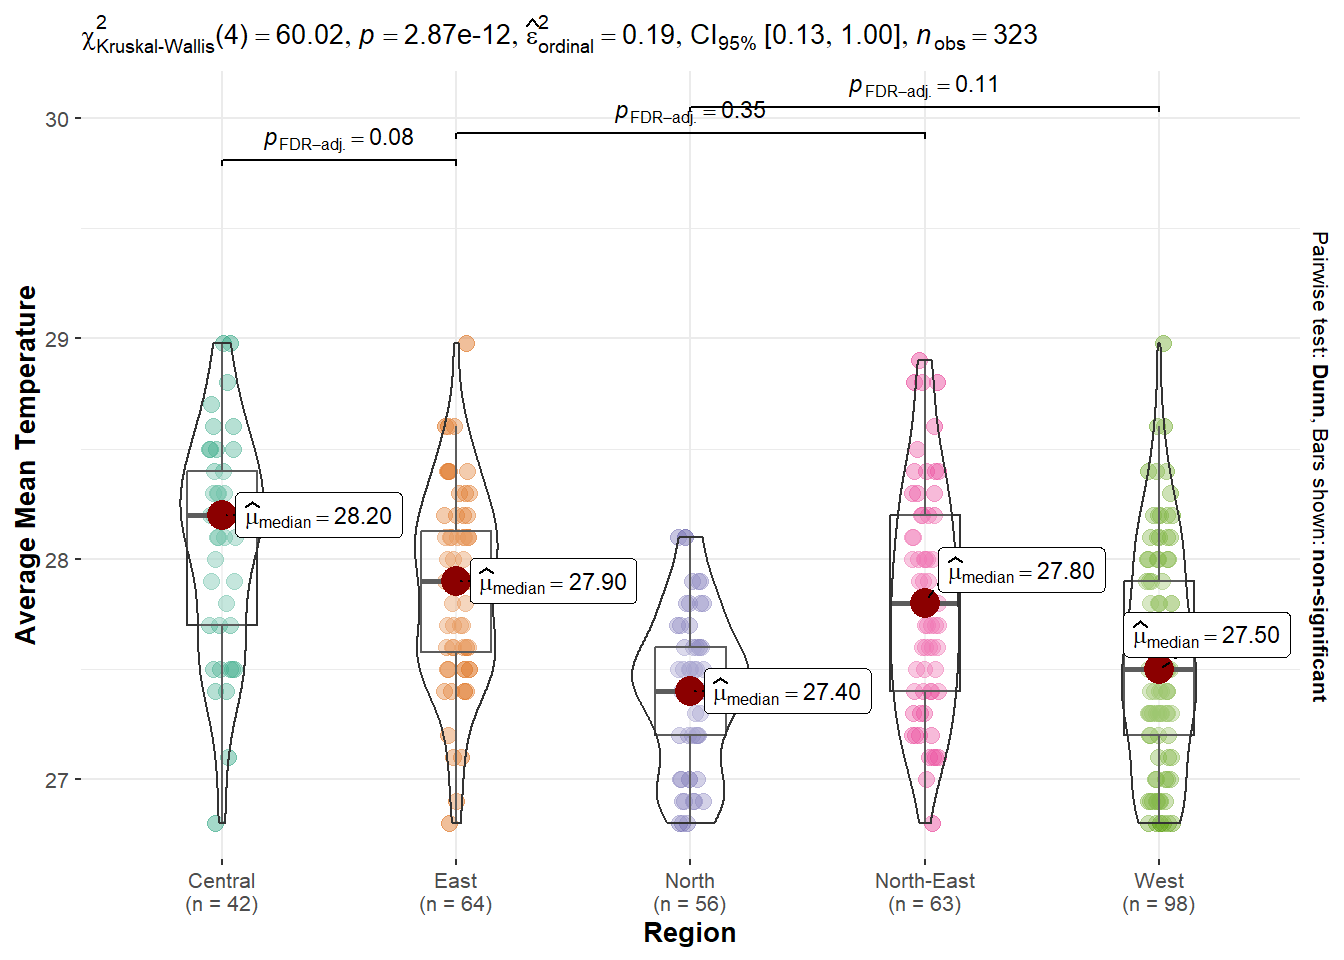
Annual_Temp_Region(metric = "Max_Temp",
                   p_type = "box",
                   t_type = "nonparametric",
                   pair_disp = "non-significant",
                   pair.comp = T,
                   conf = 0.95,
                   nooutliers = T)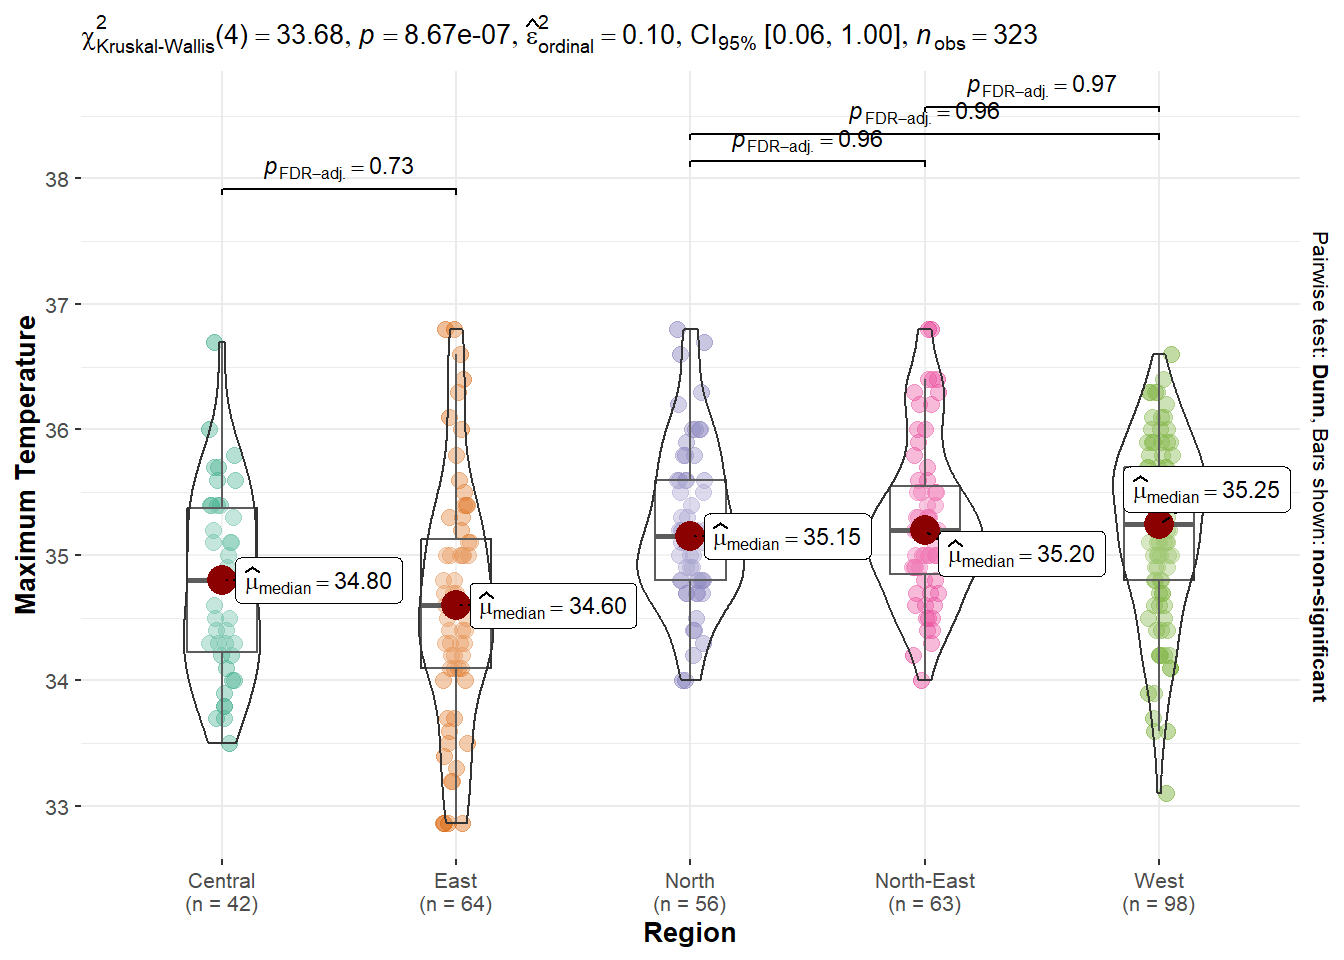
Annual_Temp_Region(metric = "Avg_Min_Temp",
                   p_type = "violin",
                   t_type = "nonparametric",
                   pair_disp = "non-significant",
                   pair.comp = T,
                   conf = 0.99,
                   nooutliers = T)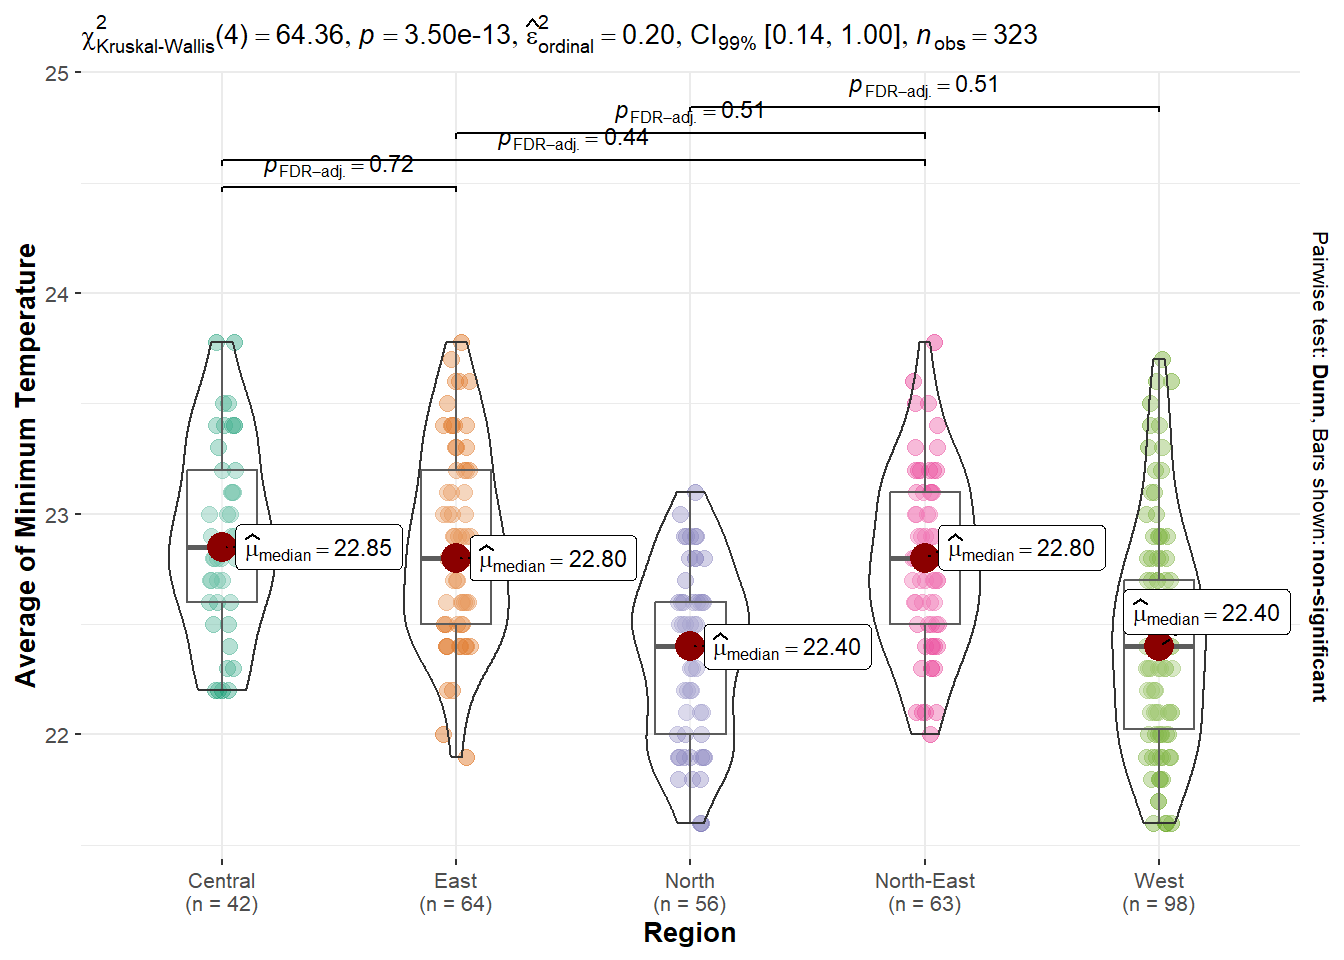
6. Compare Monthly Temperature
6.1. Create Function - Monthly temperature by Station
temp_monthly_sorted <-  temp_monthly %>%
  arrange(desc(Avg_Mean_Temp))

top3 <- temp_monthly_sorted$Station[1:3]
Monthly_Top3_Temp_Station <- function(metric = "Avg_Mean_Temp",
selected_station,
p_type = "boxviolin",
t_type = "nonparametric",
pair_disp = "non-significant",
pair.comp = T,
conf = 0.95,
nooutliers = T){
metric_label = case_when(metric == "Avg_Mean_Temp" ~ "Average Mean Temperature",
metric == "Avg_Max_Temp" ~ "Average of Max Temperature",
metric == "Avg_Min_Temp" ~ "Average of Minimum Temperature",
metric == "Max_Temp" ~ "Maximum Temperature",
metric == "Min_Temp" ~ "Minimum Temperature",
TRUE ~ metric)
test_label = case_when(t_type == "parametric" ~ "Mean (Parametric)",
t_type == "nonparametric" ~ "Median (Non-Parametric)",
t_type == "robust" ~ "Mean (Robust t-test)",
t_type == "bayes" ~ "Mean (Bayesian)",)
temp_monthly_anova <- temp_monthly %>%
filter(Station %in% selected_station) %>%
mutate(Station = fct_reorder(Station, !!sym(metric), .desc = TRUE))
if(nooutliers == T){
temp_monthly_anova <- temp_monthly_anova %>%
treat_outliers()
}
temp_monthly_anova %>%
ggbetweenstats(x = Station,
y = !!sym(metric),
plot.type = p_type,
type = t_type,
pairwise.comparisons = T,
pairwise.display = pair_disp,
mean.ci = T,
p.adjust.method = "fdr",
conf.level = conf,
xlab = "Station", ylab = metric_label,)
}Monthly_Top3_Temp_Station(metric = "Avg_Mean_Temp",
selected_station = top3,
p_type = "boxviolin",
t_type = "nonparametric",
pair_disp = "non-significant",
pair.comp = T,
conf = 0.95,
nooutliers = T)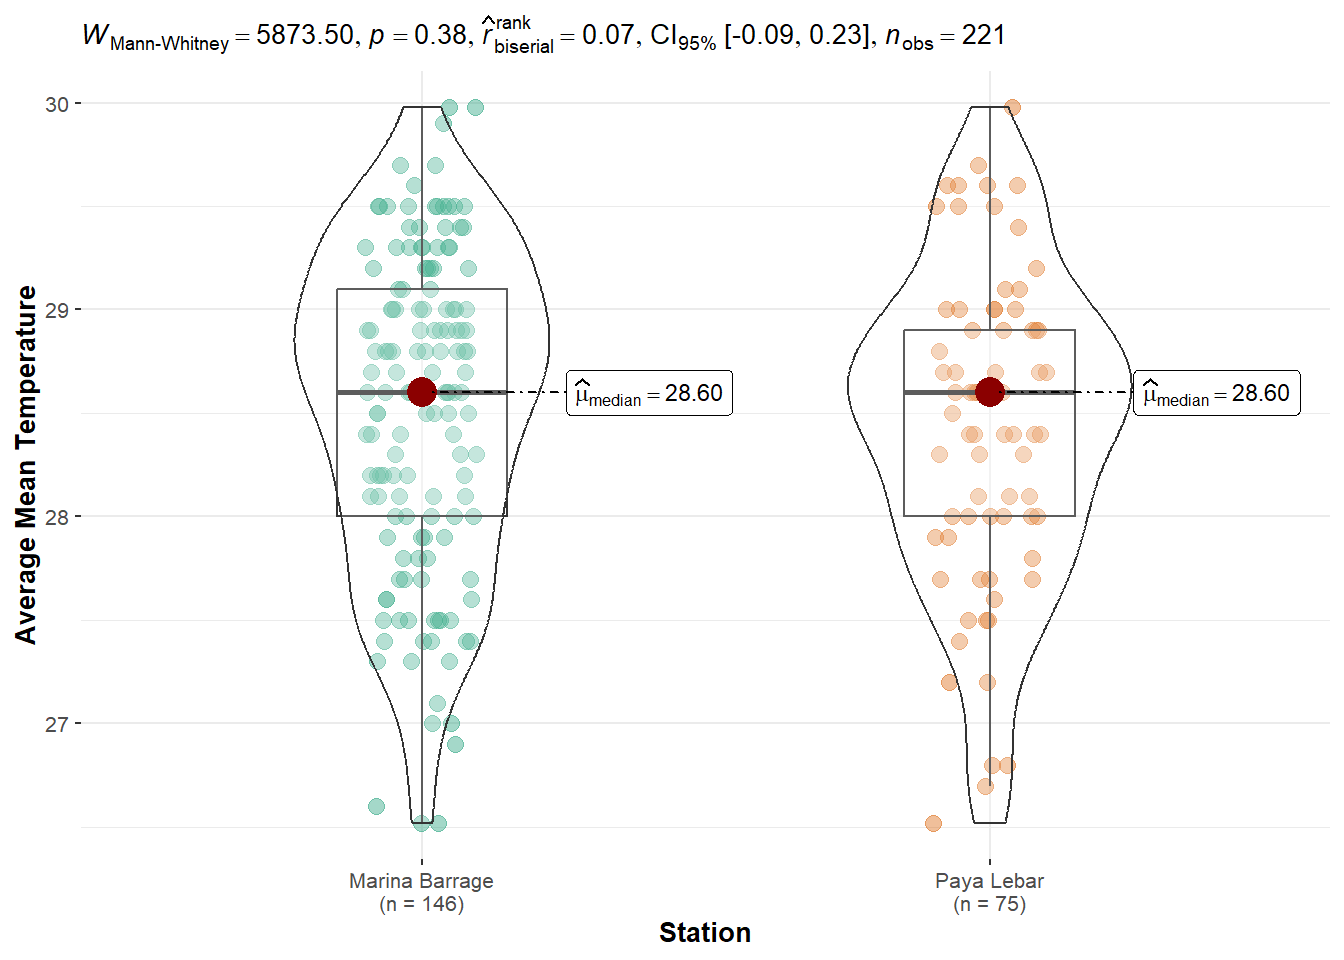
Monthly_Top3_Temp_Station(metric = "Max_Temp",
                          selected_station = top3,
                          p_type = "box",
                          t_type = "nonparametric",
                          pair_disp = "non-significant",
                          pair.comp = T,
                          conf = 0.95,
                          nooutliers = T)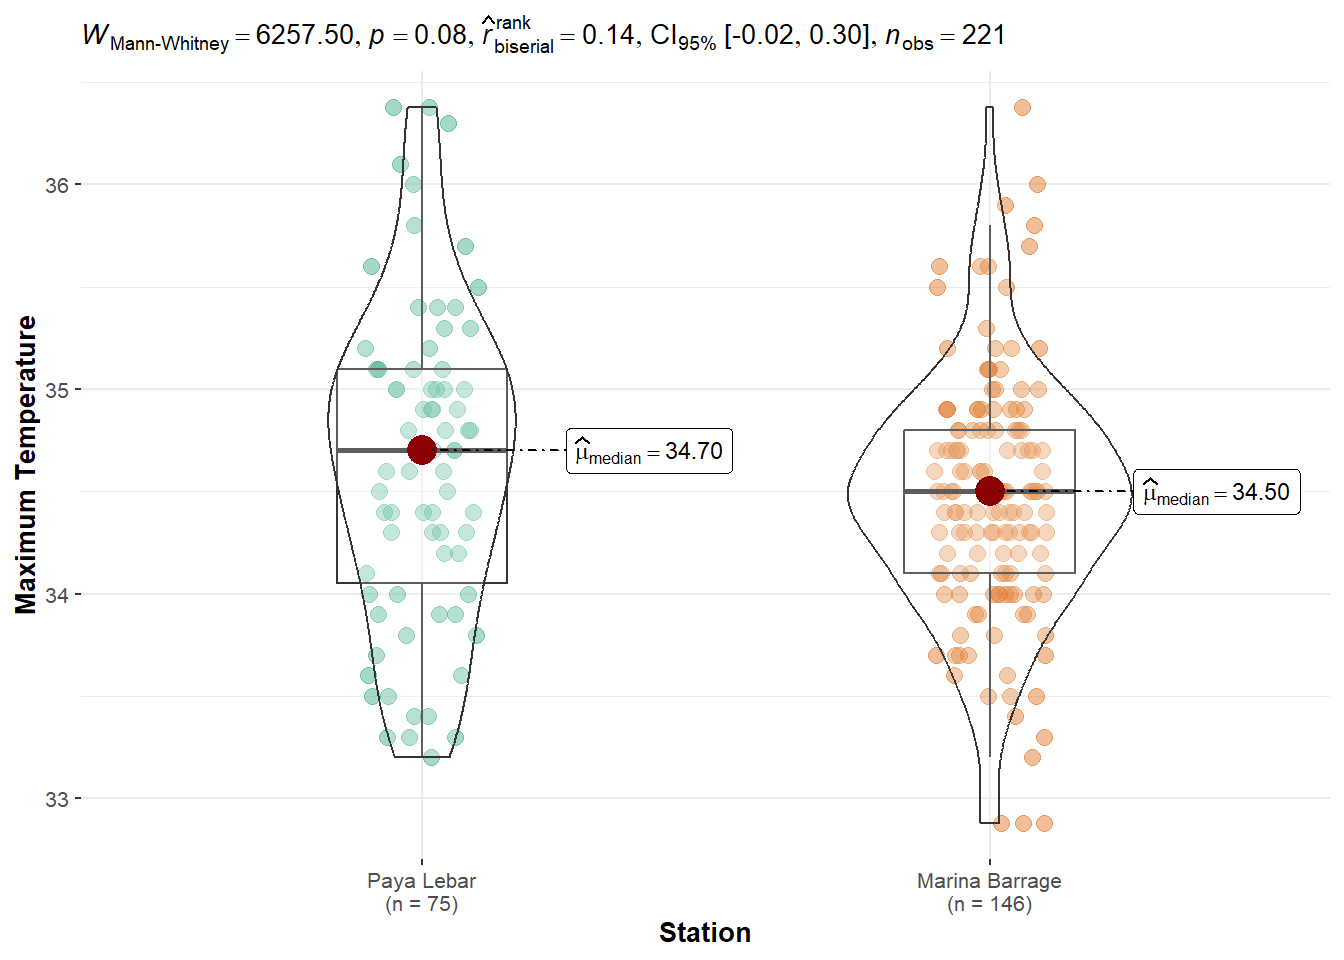
Monthly_Top3_Temp_Station(metric = "Avg_Min_Temp",
                          selected_station = top3,
                          p_type = "violin",
                          t_type = "nonparametric",
                          pair_disp = "non-significant",
                          pair.comp = T,
                          conf = 0.99,
                          nooutliers = T)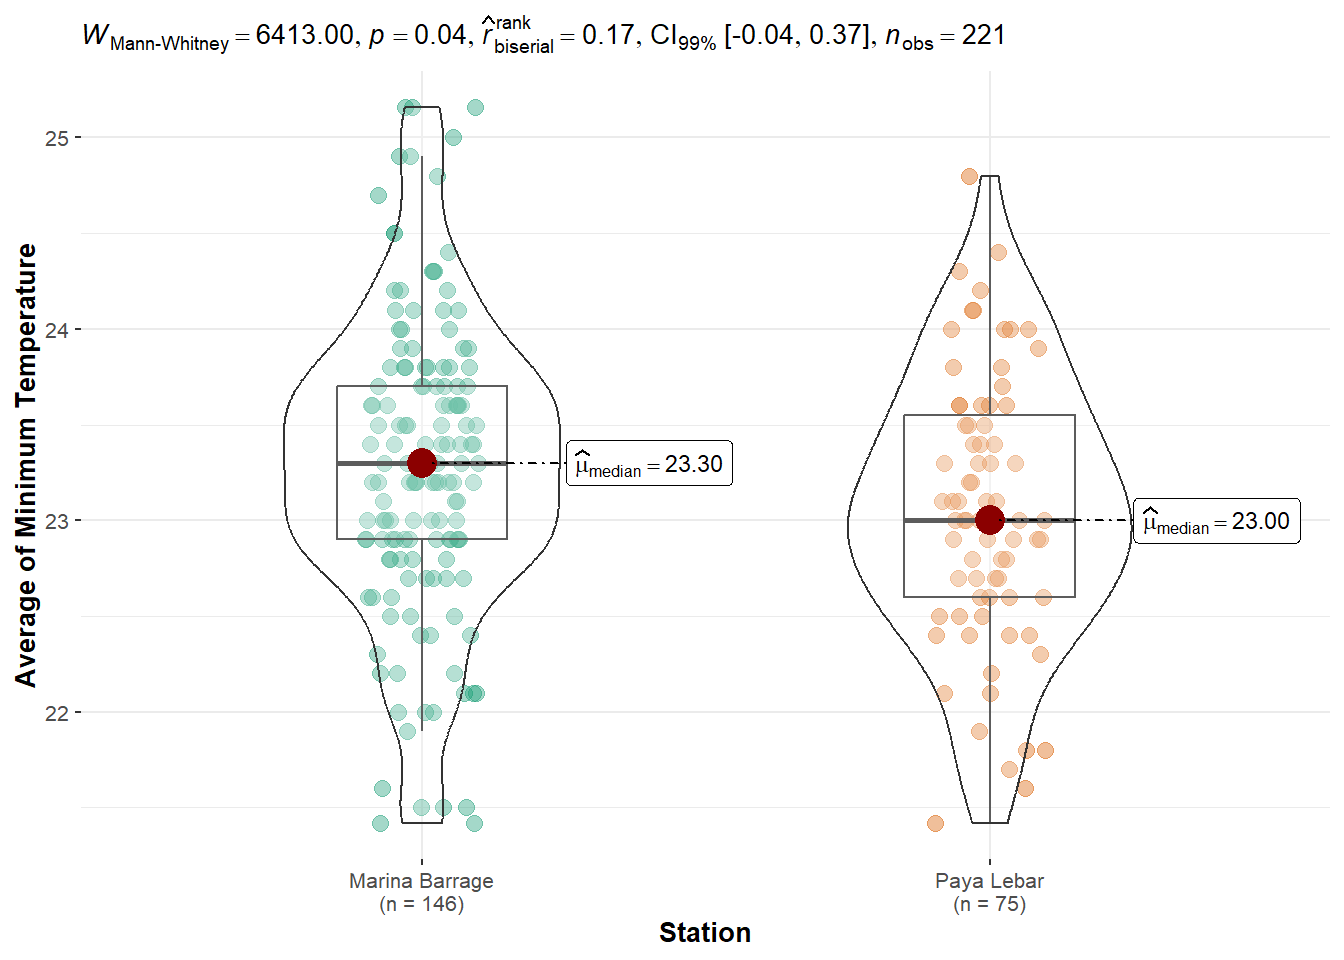
6.2. Create Function - Monthly temperature by Region
Monthly_Temp_Region <- function(metric = "Avg_Mean_Temp",
                                p_type = "boxviolin",
                                t_type = "nonparametric",
                                pair_disp = "non-significant",
                                pair.comp = T,
                                conf = 0.95,
                                nooutliers = T){

  metric_label = case_when(metric == "Avg_Mean_Temp" ~ "Average Mean Temperature",
                           metric == "Avg_Max_Temp" ~ "Average of Max Temperature",
                           metric == "Avg_Min_Temp" ~ "Average of Minimum Temperature",
                           metric == "Max_Temp" ~ "Maximum Temperature",
                           metric == "Min_Temp" ~ "Minimum Temperature",
                           TRUE ~ metric)

  test_label = case_when(t_type == "parametric" ~ "Mean (Parametric)",
                         t_type == "nonparametric" ~ "Median (Non-Parametric)",
                         t_type == "robust" ~ "Mean (Robust t-test)",
                         t_type == "bayes" ~ "Mean (Bayesian)",)

  if(nooutliers == T){
  temp_monthly <- temp_monthly %>%
      treat_outliers()
  }

  temp_monthly %>%
    ggbetweenstats(x = Region,
                   y = !!sym(metric),
                   plot.type = p_type,
                   type = t_type,
                   pairwise.comparisons = T,
                   pairwise.display = pair_disp,
                   mean.ci = T,
                   p.adjust.method = "fdr",
                   conf.level = conf,
                   xlab = "Region", ylab = metric_label,)
}Monthly_Temp_Region(metric = "Avg_Mean_Temp",
p_type = "boxviolin",
t_type = "nonparametric",
pair_disp = "non-significant",
pair.comp = T,
conf = 0.95,
nooutliers = T)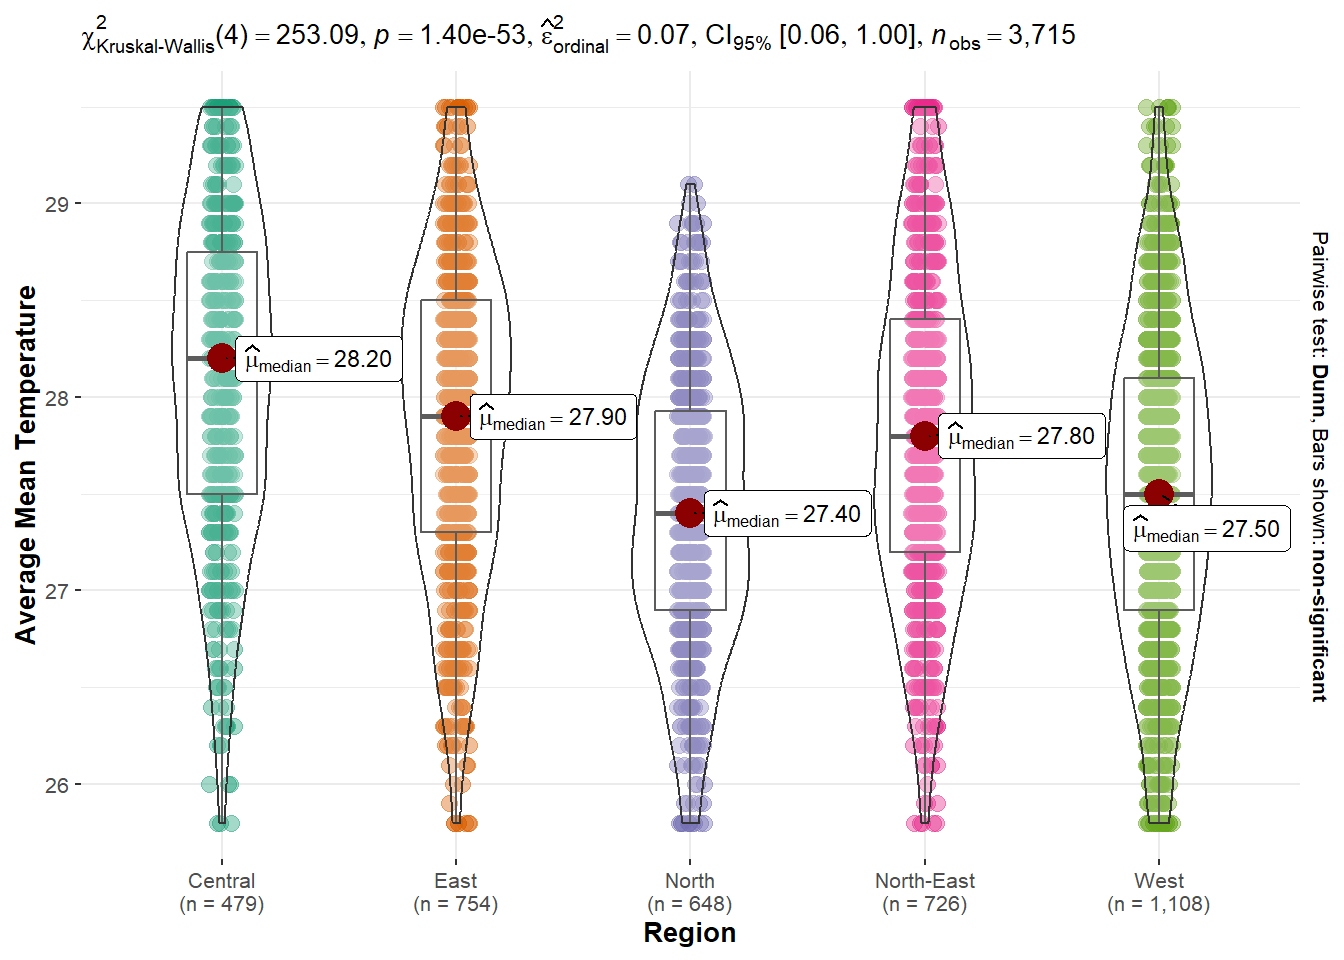
Monthly_Temp_Region(metric = "Max_Temp",
                    p_type = "box",
                    t_type = "nonparametric",
                    pair_disp = "non-significant",
                    pair.comp = T,
                    conf = 0.95,
                    nooutliers = T)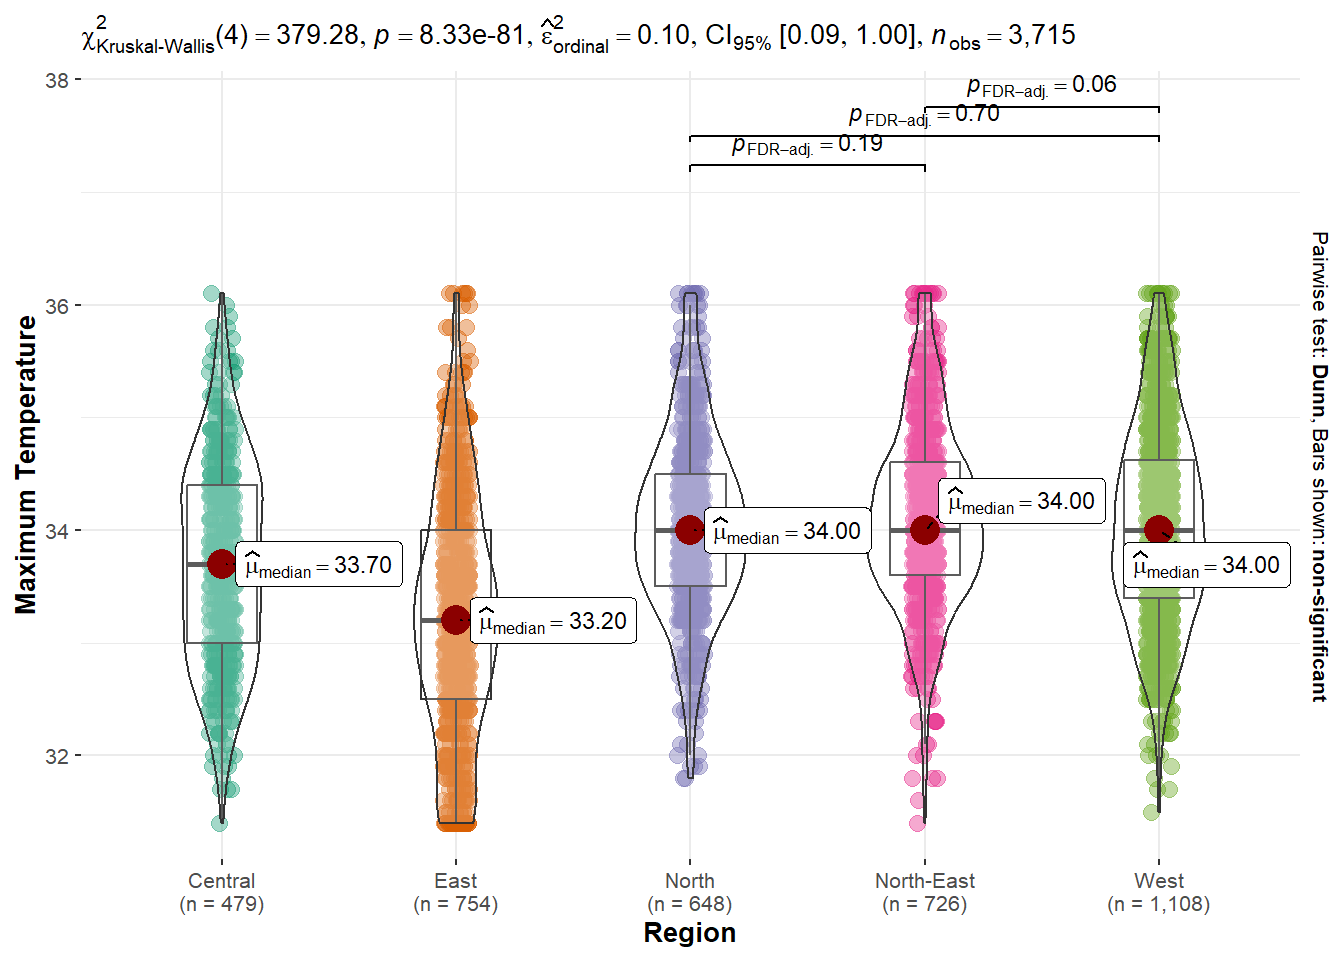
Monthly_Temp_Region(metric = "Avg_Min_Temp",
                    p_type = "violin",
                    t_type = "nonparametric",
                    pair_disp = "non-significant",
                    pair.comp = T,
                    conf = 0.99,
                    nooutliers = T)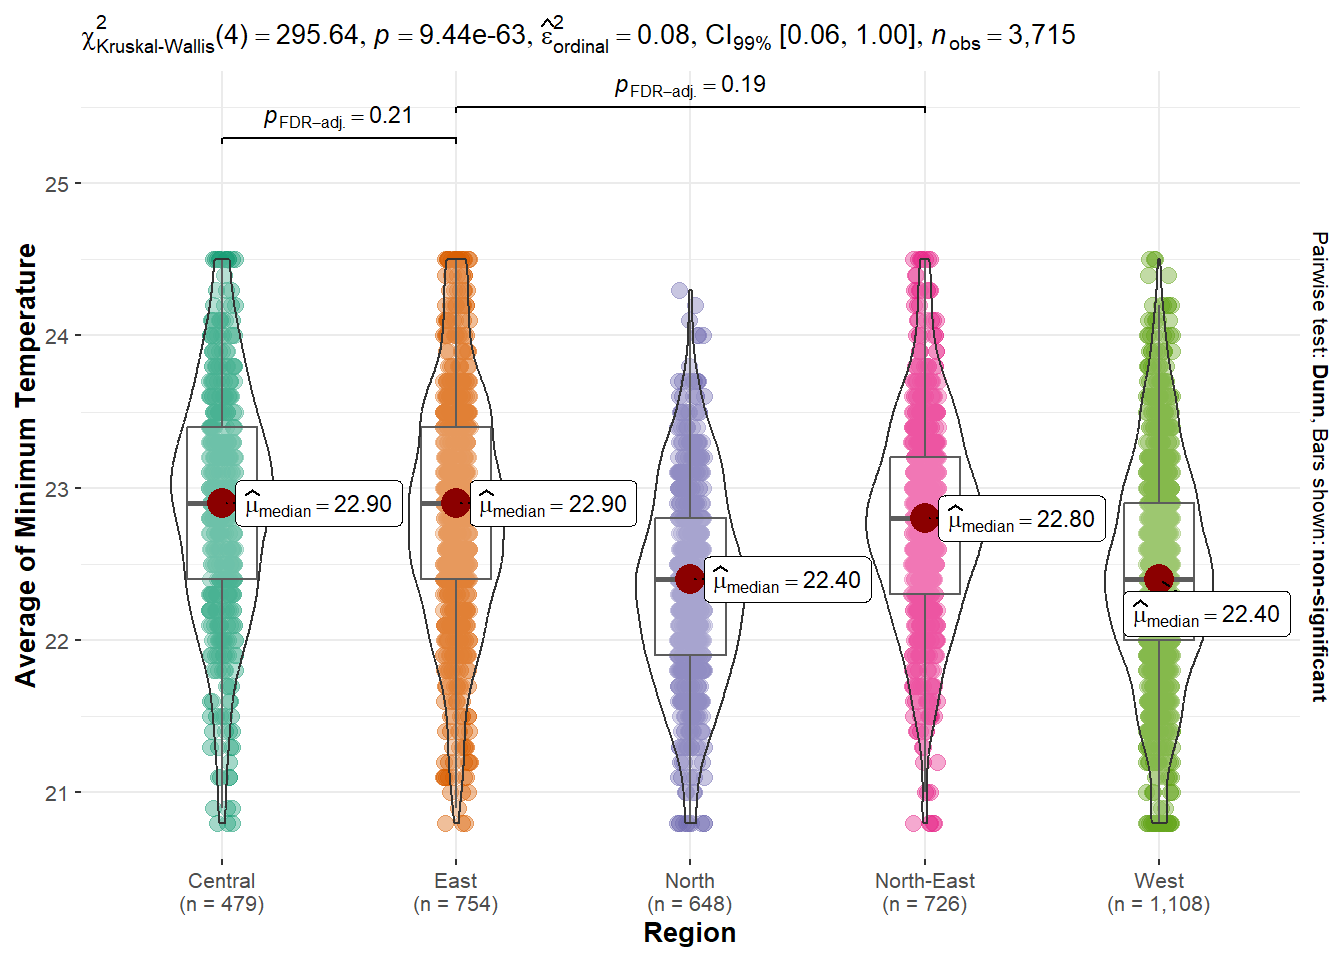
7. Compare Annual Rainfall
7.1. Create Function - Annual Rainfall by Station
rf_annual_sorted <-  rf_annual %>%
  arrange(desc(Avg_Total_Rf))

top3 <- rf_annual_sorted$Station[1:3]
Annual_Top3_Rf_Station <- function(metric = "Avg_Total_Rf",
selected_station,
p_type = "boxviolin",
t_type = "nonparametric",
pair_disp = "non-significant",
pair.comp = T,
conf = 0.95,
nooutliers = T){
metric_label = case_when(metric == "Avg_Total_Rf" ~ "Average Total Rainfall",
metric == "Avg_Total_Rf30" ~ "Average of Total Rainfall in 30 min",
metric == "Avg_Total_Rf60" ~ "Average of Total Rainfall in 60 min",
metric == "Avg_Total_Rf120" ~ "Average of Total Rainfall in 120 min",
metric == "Max_Total_Rf" ~ "Maximum Total Rainfall",
metric == "Min_Total_Rf" ~ "Minimum Total Rainfall",
TRUE ~ metric)
test_label = case_when(t_type == "parametric" ~ "Mean (Parametric)",
t_type == "nonparametric" ~ "Median (Non-Parametric)",
t_type == "robust" ~ "Mean (Robust t-test)",
t_type == "bayes" ~ "Mean (Bayesian)",)
rf_annual_anova <- rf_annual %>%
filter(Station %in% selected_station) %>%
mutate(Station = fct_reorder(Station, !!sym(metric), .desc = TRUE))
if(nooutliers == T){
rf_annual_anova <- rf_annual_anova %>%
treat_outliers()
}
rf_annual_anova %>%
ggbetweenstats(x = Station,
y = !!sym(metric),
plot.type = p_type,
type = t_type,
pairwise.comparisons = T,
pairwise.display = pair_disp,
mean.ci = T,
p.adjust.method = "fdr",
conf.level = conf,
xlab = "Station", ylab = metric_label,)
}Annual_Top3_Rf_Station(metric = "Avg_Total_Rf",
selected_station = top3,
p_type = "boxviolin",
t_type = "nonparametric",
pair_disp = "non-significant",
pair.comp = T,
conf = 0.95,
nooutliers = T)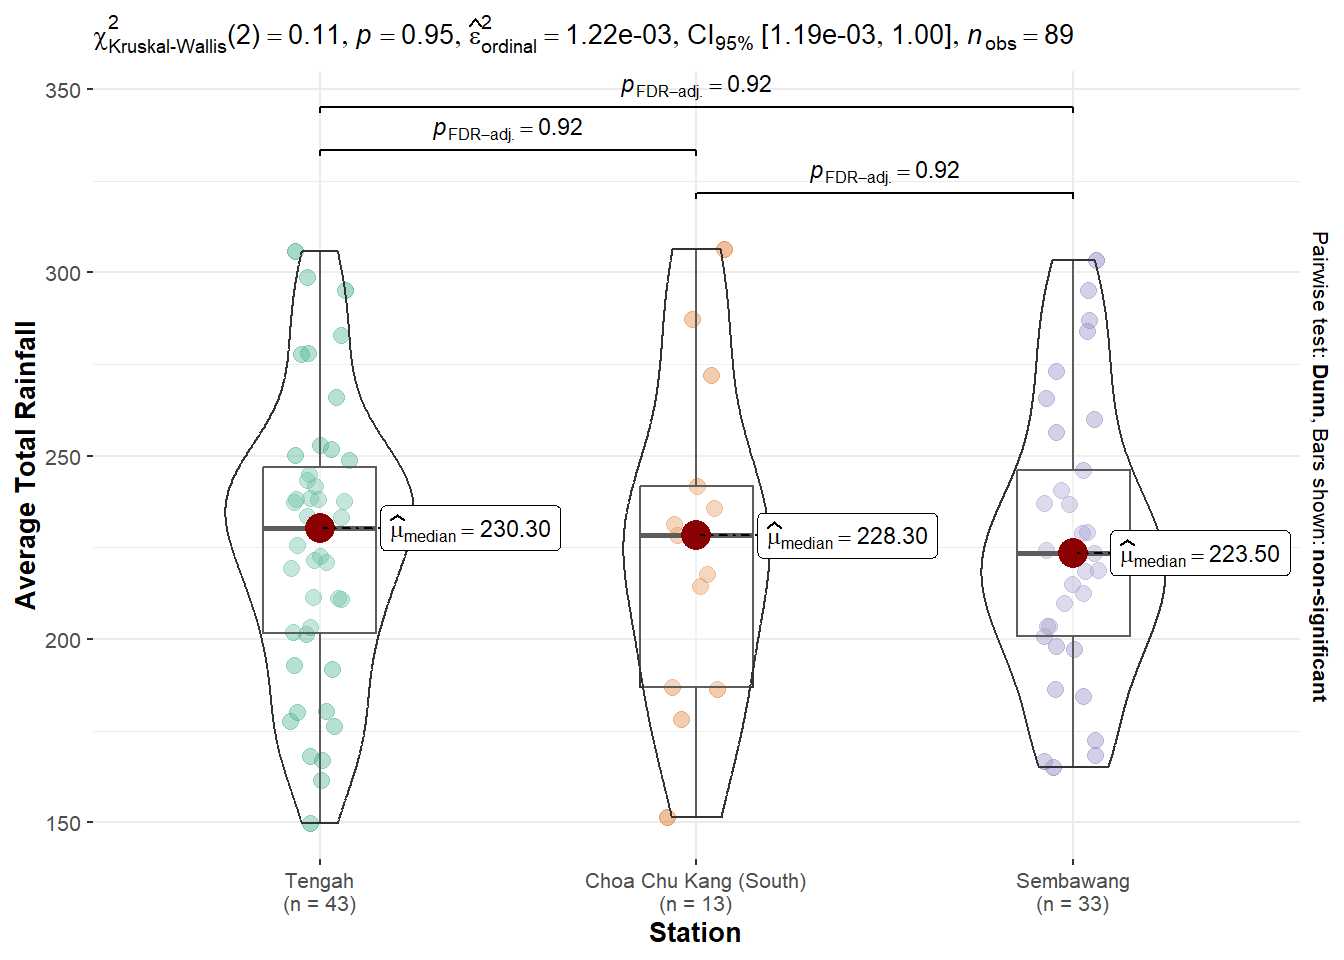
Annual_Top3_Rf_Station(metric = "Avg_Total_Rf60",
                         selected_station = top3,
                         p_type = "box",
                         t_type = "nonparametric",
                         pair_disp = "non-significant",
                         pair.comp = T,
                         conf = 0.95,
                         nooutliers = T)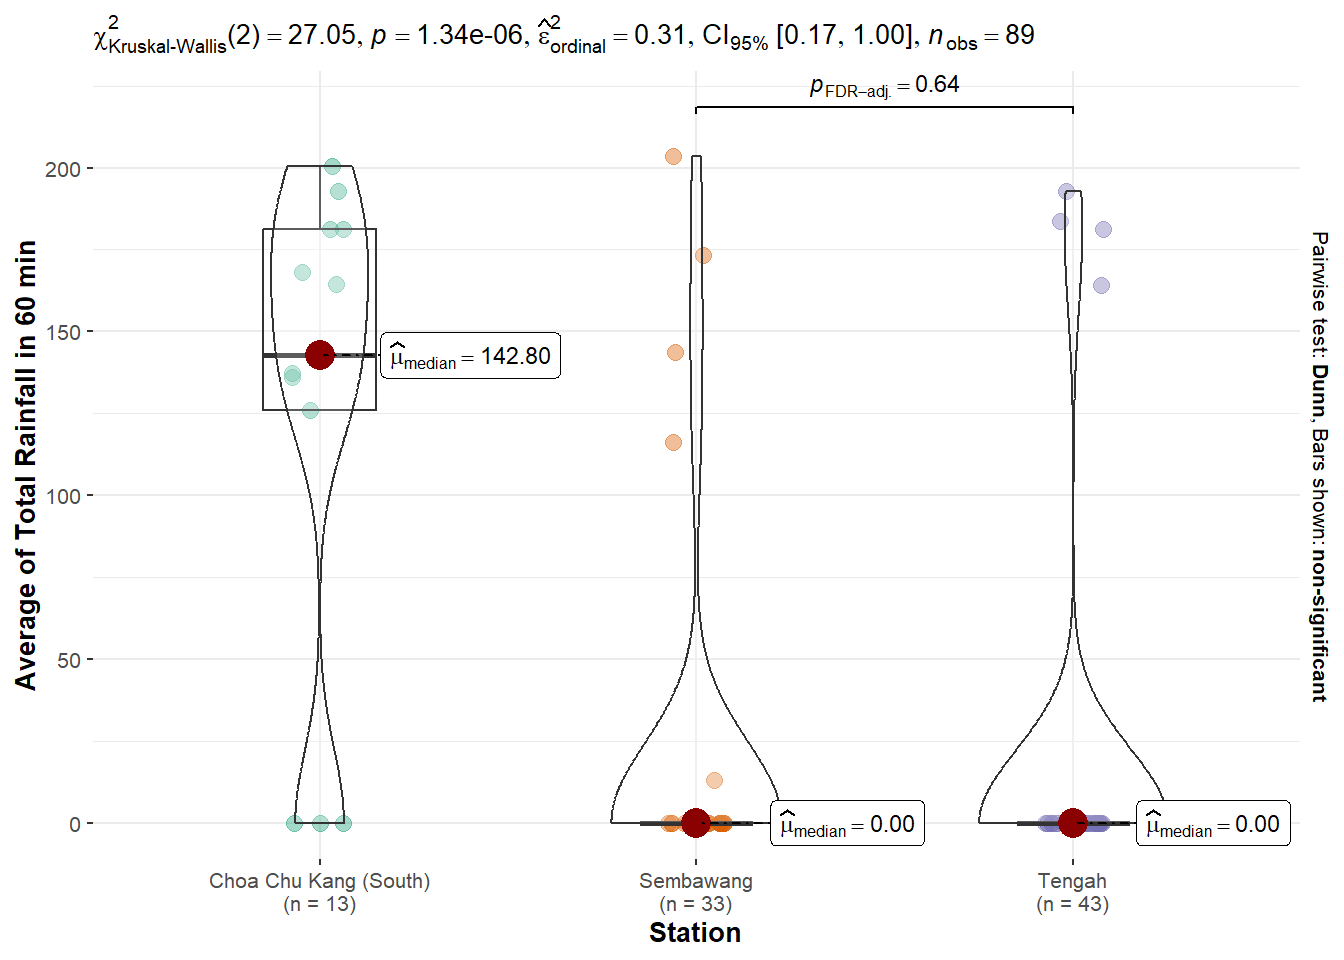
Annual_Top3_Rf_Station(metric = "Max_Total_Rf",
                         selected_station = top3,
                         p_type = "violin",
                         t_type = "nonparametric",
                         pair_disp = "non-significant",
                         pair.comp = T,
                         conf = 0.99,
                         nooutliers = T)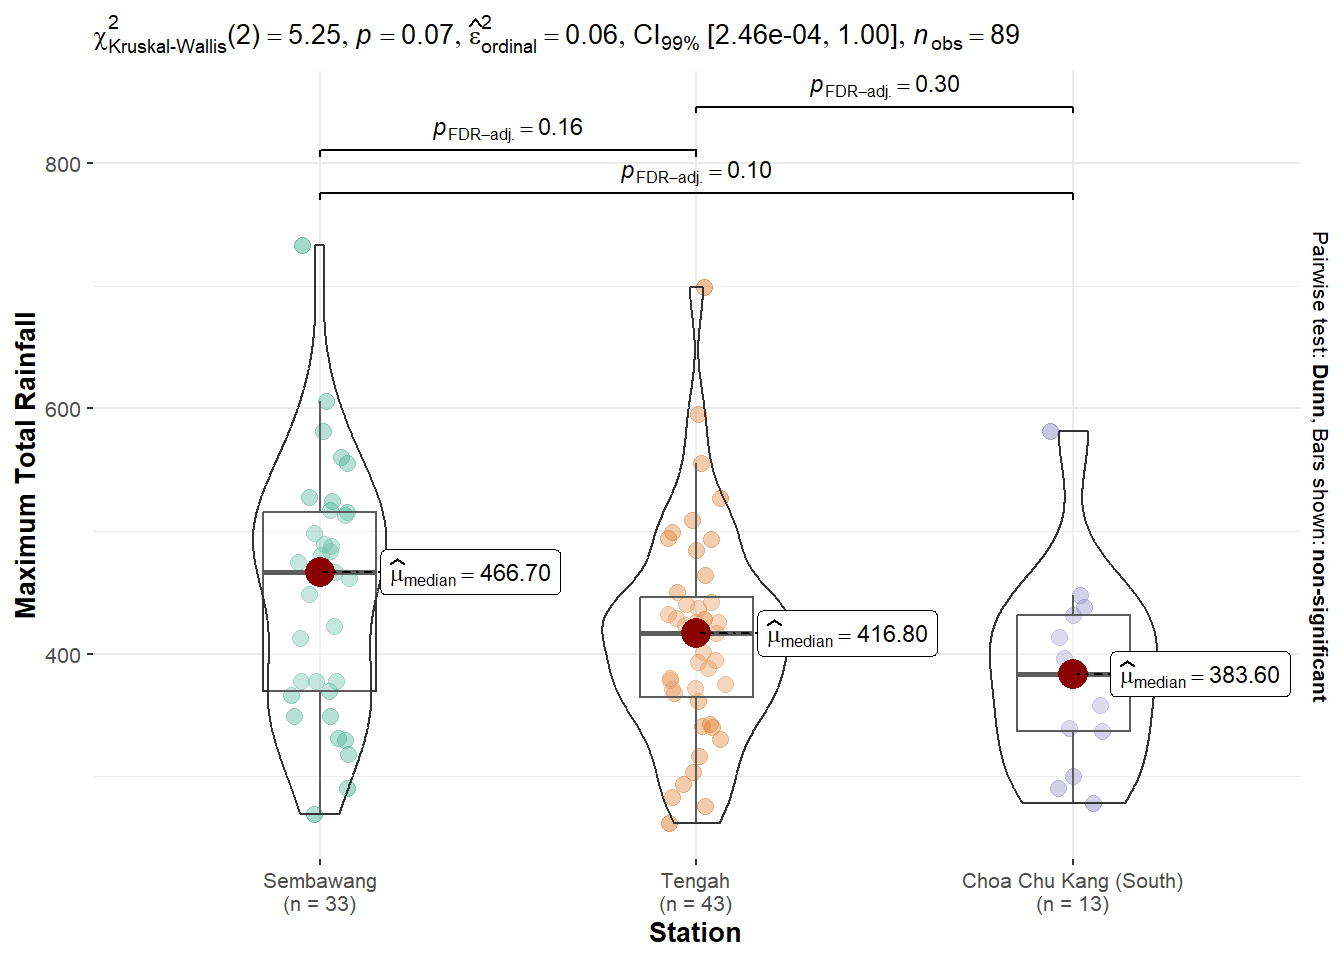
7.2. Create Function - Annual Rainfall by Region
Annual_Rf_Region <- function(metric = "Avg_Total_Rf",
                               p_type = "boxviolin",
                               t_type = "nonparametric",
                               pair_disp = "non-significant",
                               pair.comp = T,
                               conf = 0.95,
                               nooutliers = T){

  metric_label = case_when(metric == "Avg_Total_Rf" ~ "Average Total Rainfall",
                           metric == "Avg_Total_Rf30" ~ "Average of Total Rainfall in 30 min",
                           metric == "Avg_Total_Rf60" ~ "Average of Total Rainfall in 60 min",
                           metric == "Avg_Total_Rf120" ~ "Average of Total Rainfall in 120 min",
                           metric == "Max_Total_Rf" ~ "Maximum Total Rainfall",
                           metric == "Min_Total_Rf" ~ "Minimum Total Rainfall",
                           TRUE ~ metric)

  test_label = case_when(t_type == "parametric" ~ "Mean (Parametric)",
                         t_type == "nonparametric" ~ "Median (Non-Parametric)",
                         t_type == "robust" ~ "Mean (Robust t-test)",
                         t_type == "bayes" ~ "Mean (Bayesian)",)

  if(nooutliers == T){
  rf_annual <- rf_annual %>%
      treat_outliers()
  }

  rf_annual %>%
    ggbetweenstats(x = Region,
                   y = !!sym(metric),
                   plot.type = p_type,
                   type = t_type,
                   pairwise.comparisons = T,
                   pairwise.display = pair_disp,
                   mean.ci = T,
                   p.adjust.method = "fdr",
                   conf.level = conf,
                   xlab = "Region", ylab = metric_label,)
}Annual_Rf_Region(metric = "Avg_Total_Rf",
p_type = "violin",
t_type = "nonparametric",
pair_disp = "non-significant",
pair.comp = T,
conf = 0.99,
nooutliers = T)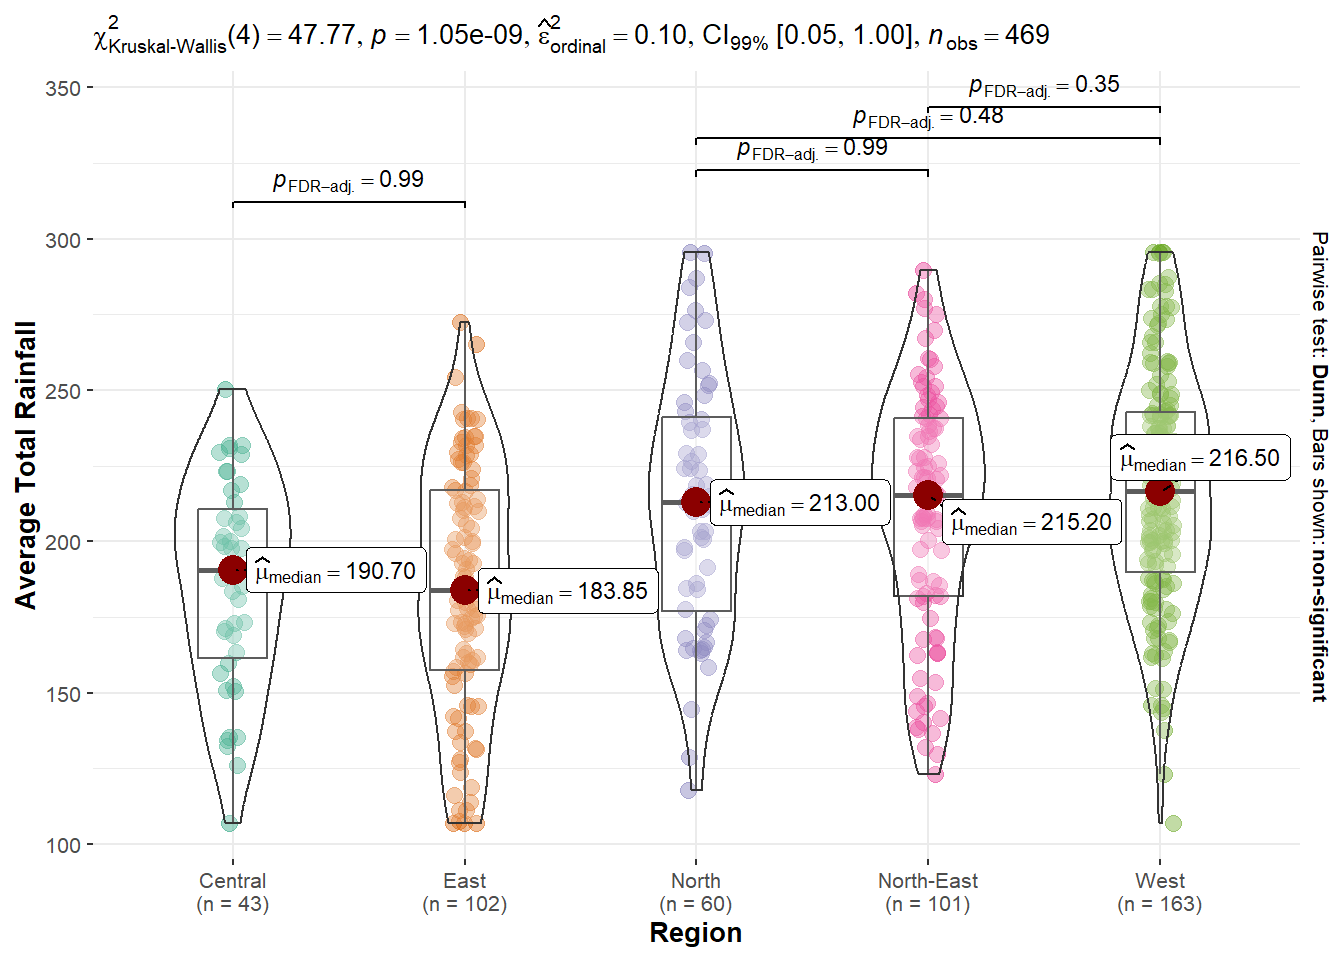
Annual_Rf_Region(metric = "Avg_Total_Rf60",
                   p_type = "box",
                   t_type = "nonparametric",
                   pair_disp = "non-significant",
                   pair.comp = T,
                   conf = 0.95,
                   nooutliers = T)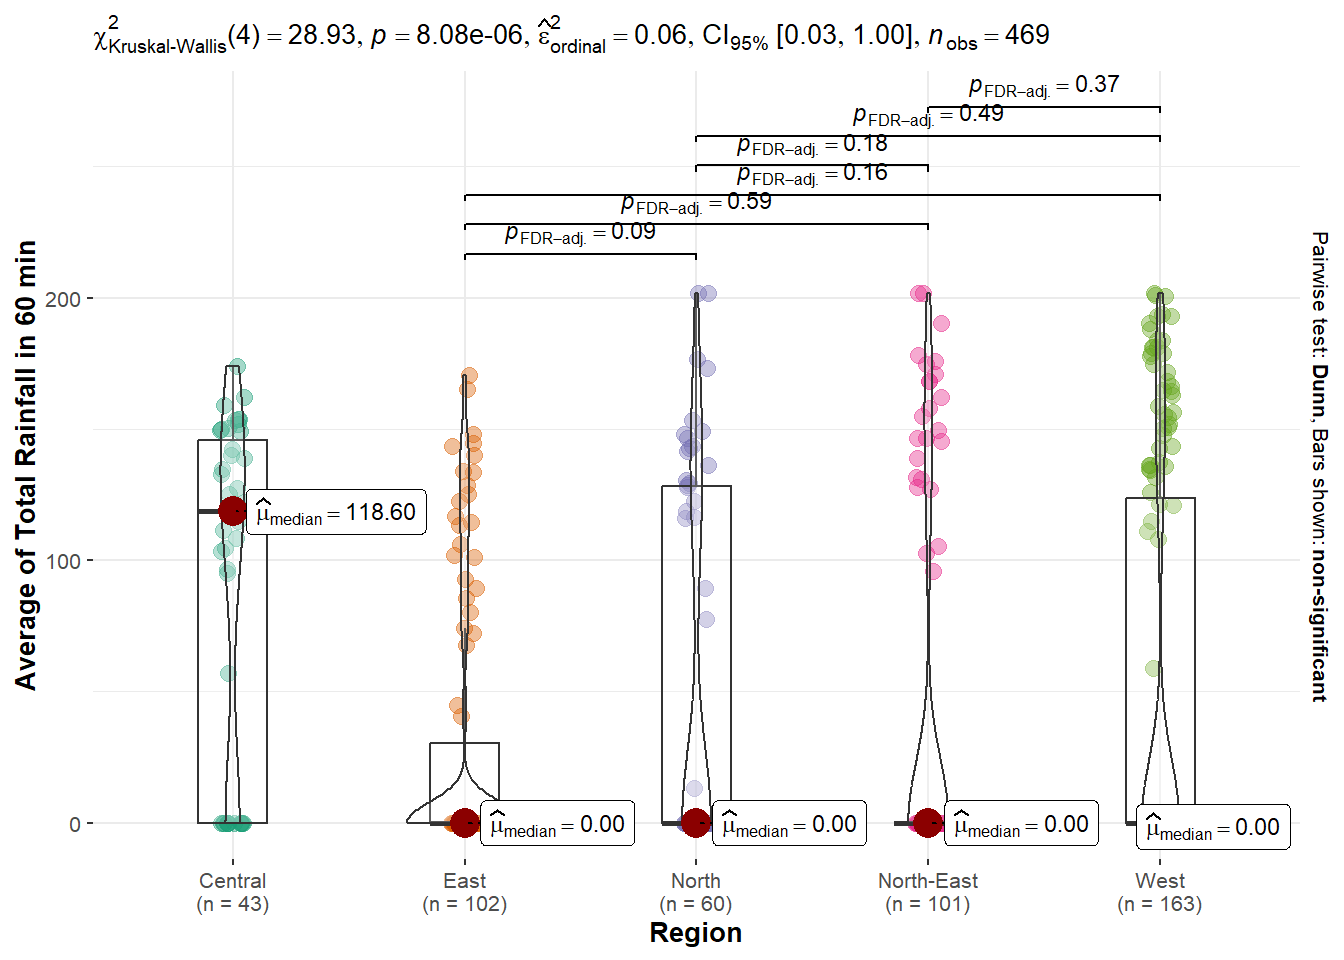
Annual_Rf_Region(metric = "Max_Total_Rf",
                   p_type = "violin",
                   t_type = "nonparametric",
                   pair_disp = "non-significant",
                   pair.comp = T,
                   conf = 0.99,
                   nooutliers = T)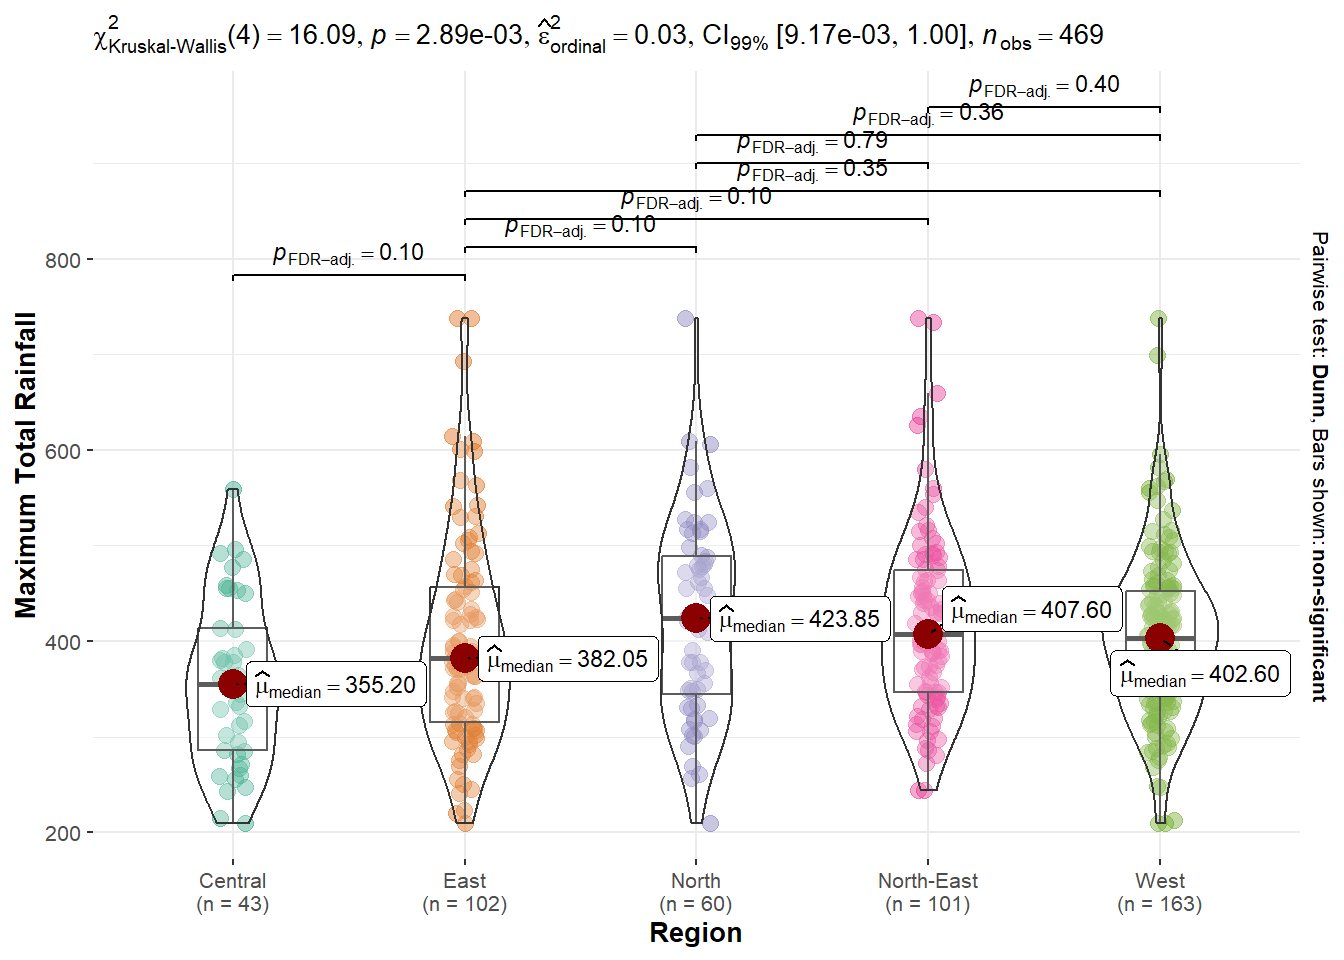
8. Compare Monthly Rainfall
8.1. Create Function - Monthly Rainfall by Station
rf_monthly_sorted <-  rf_monthly %>%
  arrange(desc(Avg_Total_Rf))

top3 <- rf_monthly_sorted$Station[1:3]
Monthly_Rf_Station <- function(metric = "Avg_Total_Rf",
selected_station,
p_type = "boxviolin",
t_type = "nonparametric",
pair_disp = "non-significant",
pair.comp = T,
conf = 0.95,
nooutliers = T){
metric_label = case_when(metric == "Avg_Total_Rf" ~ "Average Total Rainfall",
metric == "Avg_Total_Rf30" ~ "Average of Total Rainfall in 30 min",
metric == "Avg_Total_Rf60" ~ "Average of Total Rainfall in 60 min",
metric == "Avg_Total_Rf120" ~ "Average of Total Rainfall in 120 min",
metric == "Max_Total_Rf" ~ "Maximum Total Rainfall",
metric == "Min_Total_Rf" ~ "Minimum Total Rainfall",
TRUE ~ metric)
test_label = case_when(t_type == "parametric" ~ "Mean (Parametric)",
t_type == "nonparametric" ~ "Median (Non-Parametric)",
t_type == "robust" ~ "Mean (Robust t-test)",
t_type == "bayes" ~ "Mean (Bayesian)",)
rf_monthly_anova <- rf_monthly %>%
filter(Station %in% selected_station) %>%
mutate(Station = fct_reorder(Station, !!sym(metric), .desc = TRUE))
if(nooutliers == T){
rf_monthly_anova <- rf_monthly_anova %>%
treat_outliers()
}
rf_monthly_anova %>%
ggbetweenstats(x = Station,
y = !!sym(metric),
plot.type = p_type,
type = t_type,
pairwise.comparisons = T,
pairwise.display = pair_disp,
mean.ci = T,
p.adjust.method = "fdr",
conf.level = conf,
xlab = "Station", ylab = metric_label,)
}Monthly_Rf_Station(metric = "Avg_Total_Rf",
selected_station = top3,
p_type = "boxviolin",
t_type = "nonparametric",
pair_disp = "non-significant",
pair.comp = T,
conf = 0.95,
nooutliers = T)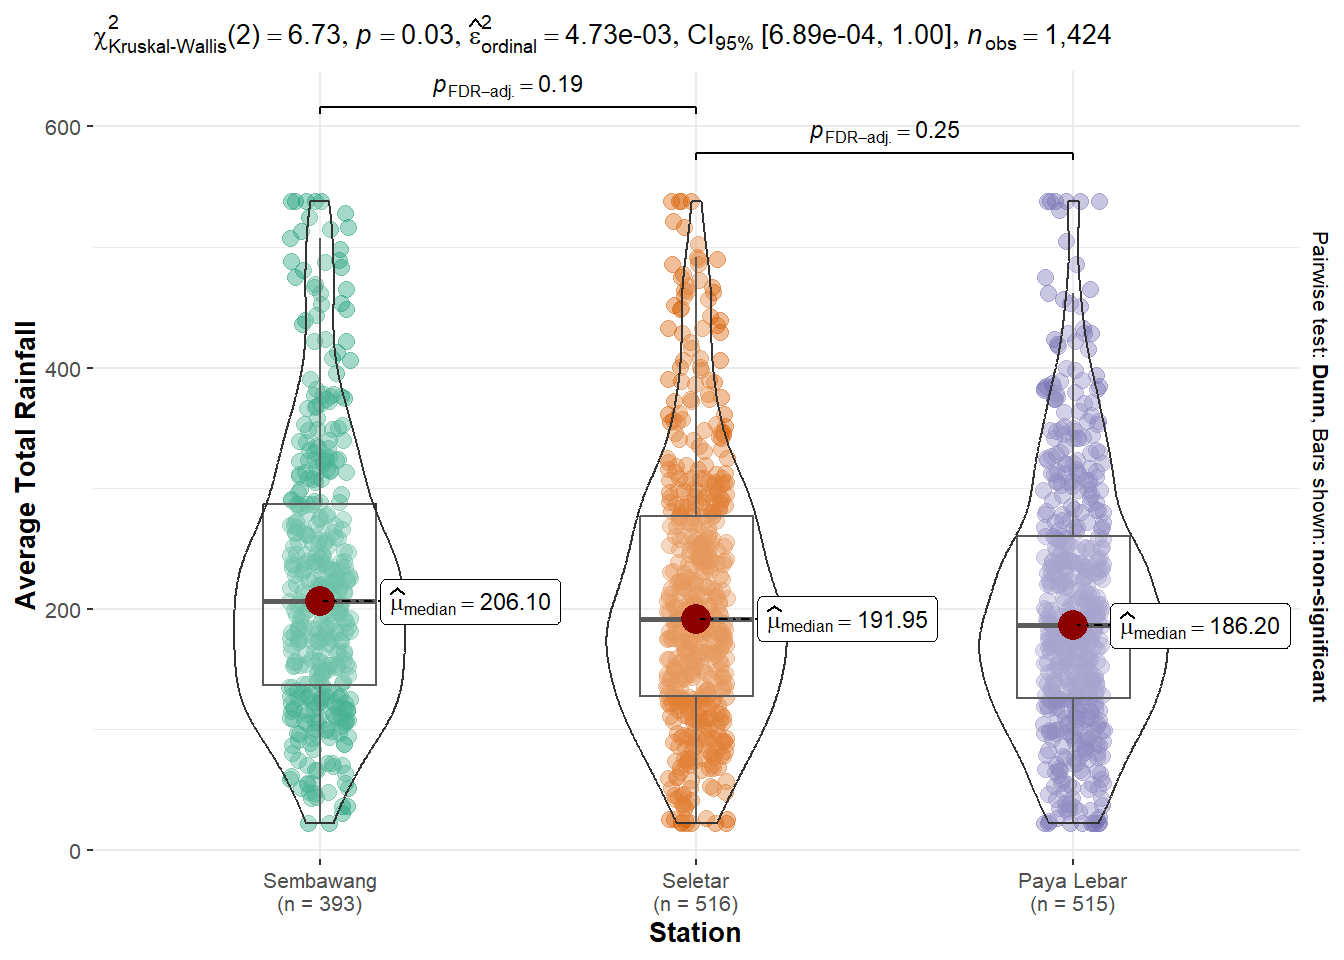
Monthly_Rf_Station(metric = "Avg_Total_Rf60",
                         selected_station = top3,
                         p_type = "box",
                         t_type = "nonparametric",
                         pair_disp = "non-significant",
                         pair.comp = T,
                         conf = 0.95,
                         nooutliers = T)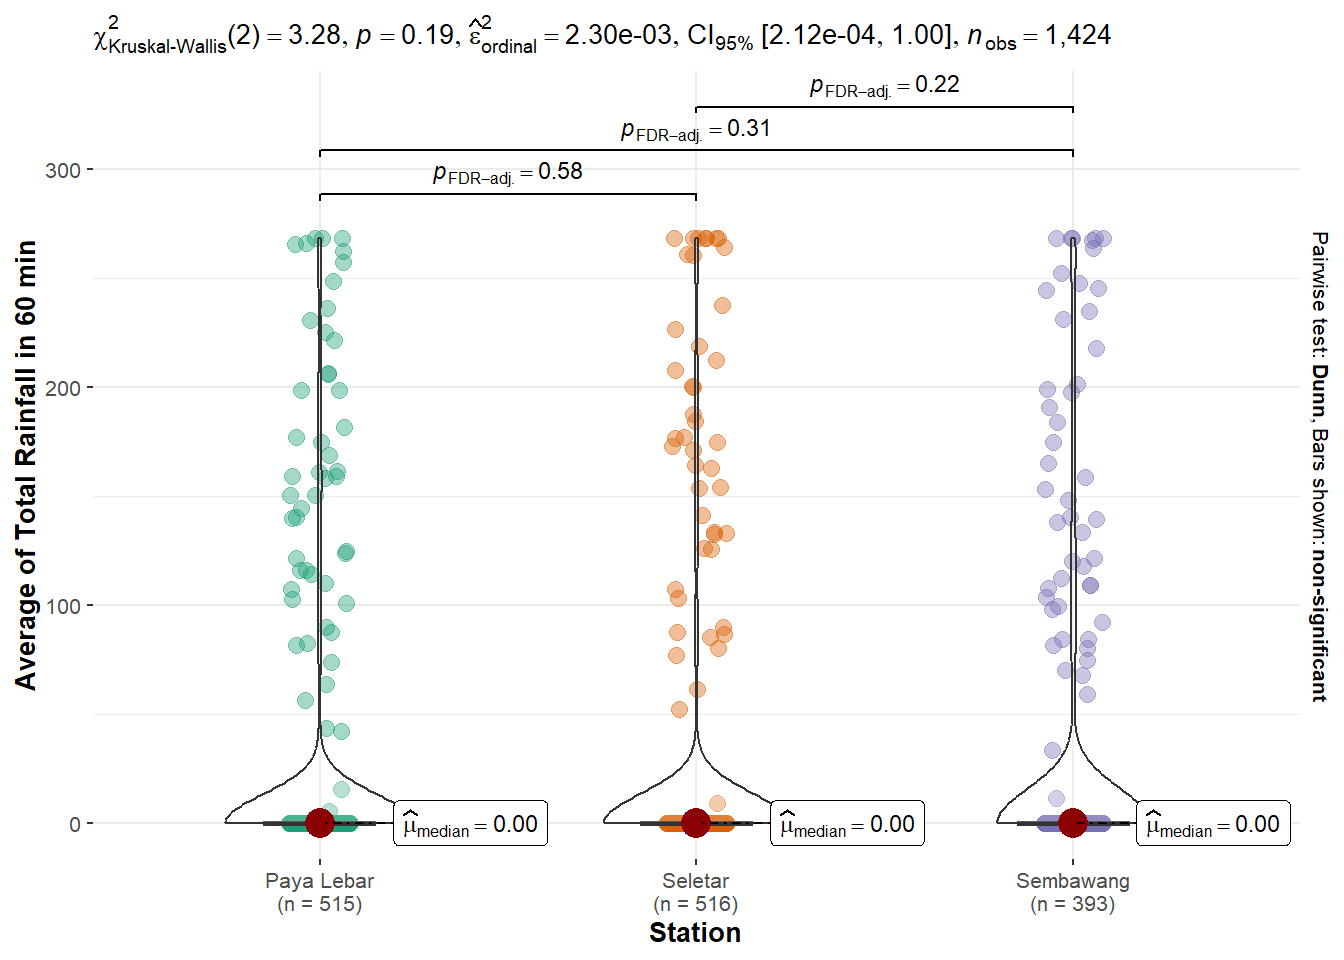
Monthly_Rf_Station(metric = "Max_Total_Rf",
                         selected_station = top3,
                         p_type = "violin",
                         t_type = "nonparametric",
                         pair_disp = "non-significant",
                         pair.comp = T,
                         conf = 0.99,
                         nooutliers = T)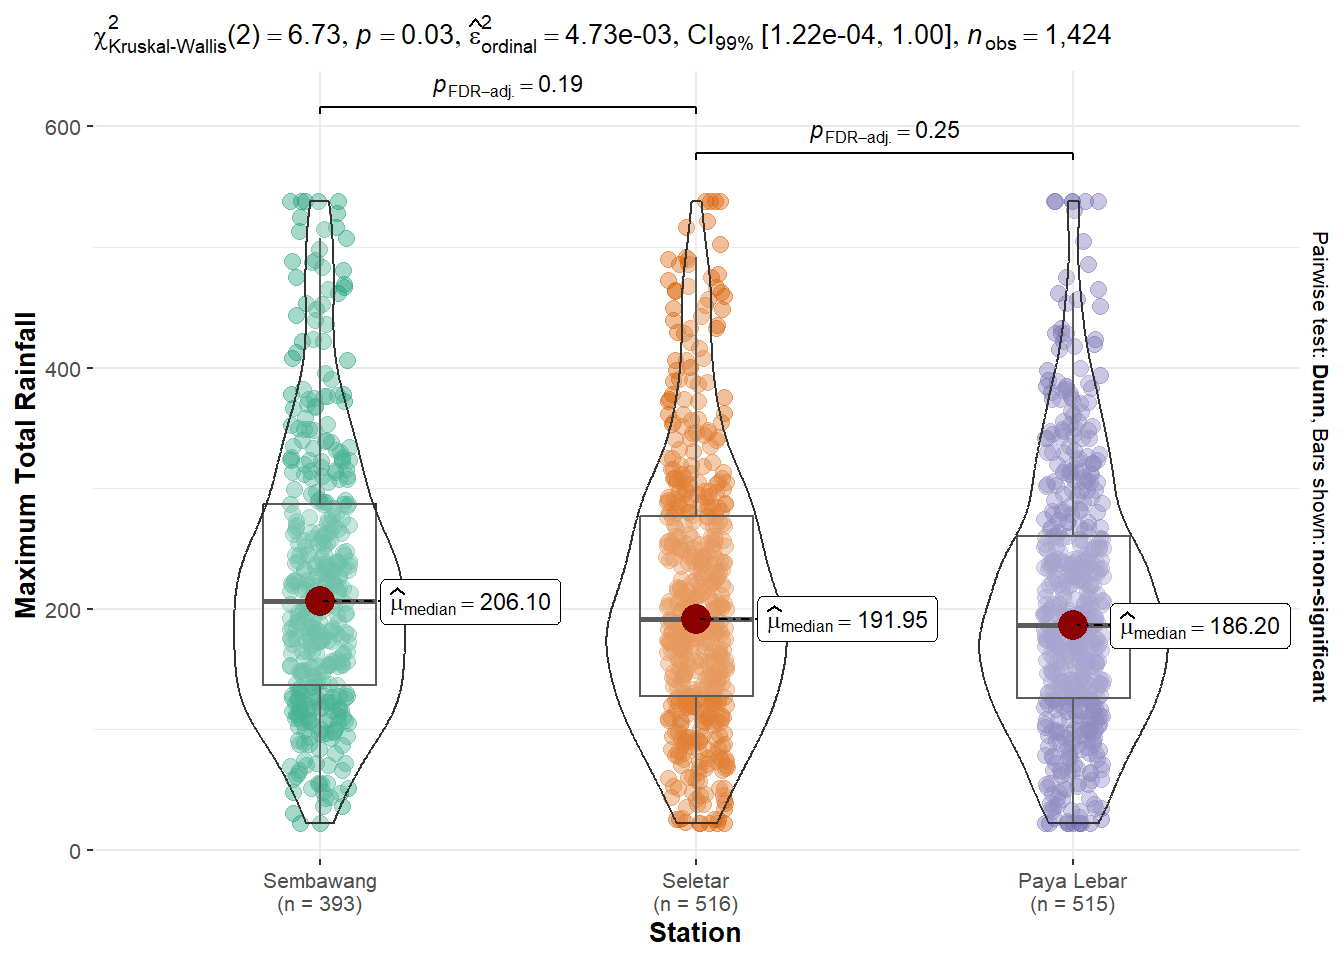
8.2. Create Function - Monthly Rainfall by Region
Monthly_Rf_Region <- function(metric = "Avg_Total_Rf",
                               p_type = "boxviolin",
                               t_type = "nonparametric",
                               pair_disp = "non-significant",
                               pair.comp = T,
                               conf = 0.95,
                               nooutliers = T){

  metric_label = case_when(metric == "Avg_Total_Rf" ~ "Average Total Rainfall",
                           metric == "Avg_Total_Rf30" ~ "Average of Total Rainfall in 30 min",
                           metric == "Avg_Total_Rf60" ~ "Average of Total Rainfall in 60 min",
                           metric == "Avg_Total_Rf120" ~ "Average of Total Rainfall in 120 min",
                           metric == "Max_Total_Rf" ~ "Maximum Total Rainfall",
                           metric == "Min_Total_Rf" ~ "Minimum Total Rainfall",
                           TRUE ~ metric)

  test_label = case_when(t_type == "parametric" ~ "Mean (Parametric)",
                         t_type == "nonparametric" ~ "Median (Non-Parametric)",
                         t_type == "robust" ~ "Mean (Robust t-test)",
                         t_type == "bayes" ~ "Mean (Bayesian)",)

  if(nooutliers == T){
  rf_monthly <- rf_monthly %>%
      treat_outliers()
  }

  rf_monthly %>%
    ggbetweenstats(x = Region,
                   y = !!sym(metric),
                   plot.type = p_type,
                   type = t_type,
                   pairwise.comparisons = T,
                   pairwise.display = pair_disp,
                   mean.ci = T,
                   p.adjust.method = "fdr",
                   conf.level = conf,
                   xlab = "Region", ylab = metric_label,)
}Monthly_Rf_Region(metric = "Avg_Total_Rf",
p_type = "violin",
t_type = "nonparametric",
pair_disp = "non-significant",
pair.comp = T,
conf = 0.99,
nooutliers = T)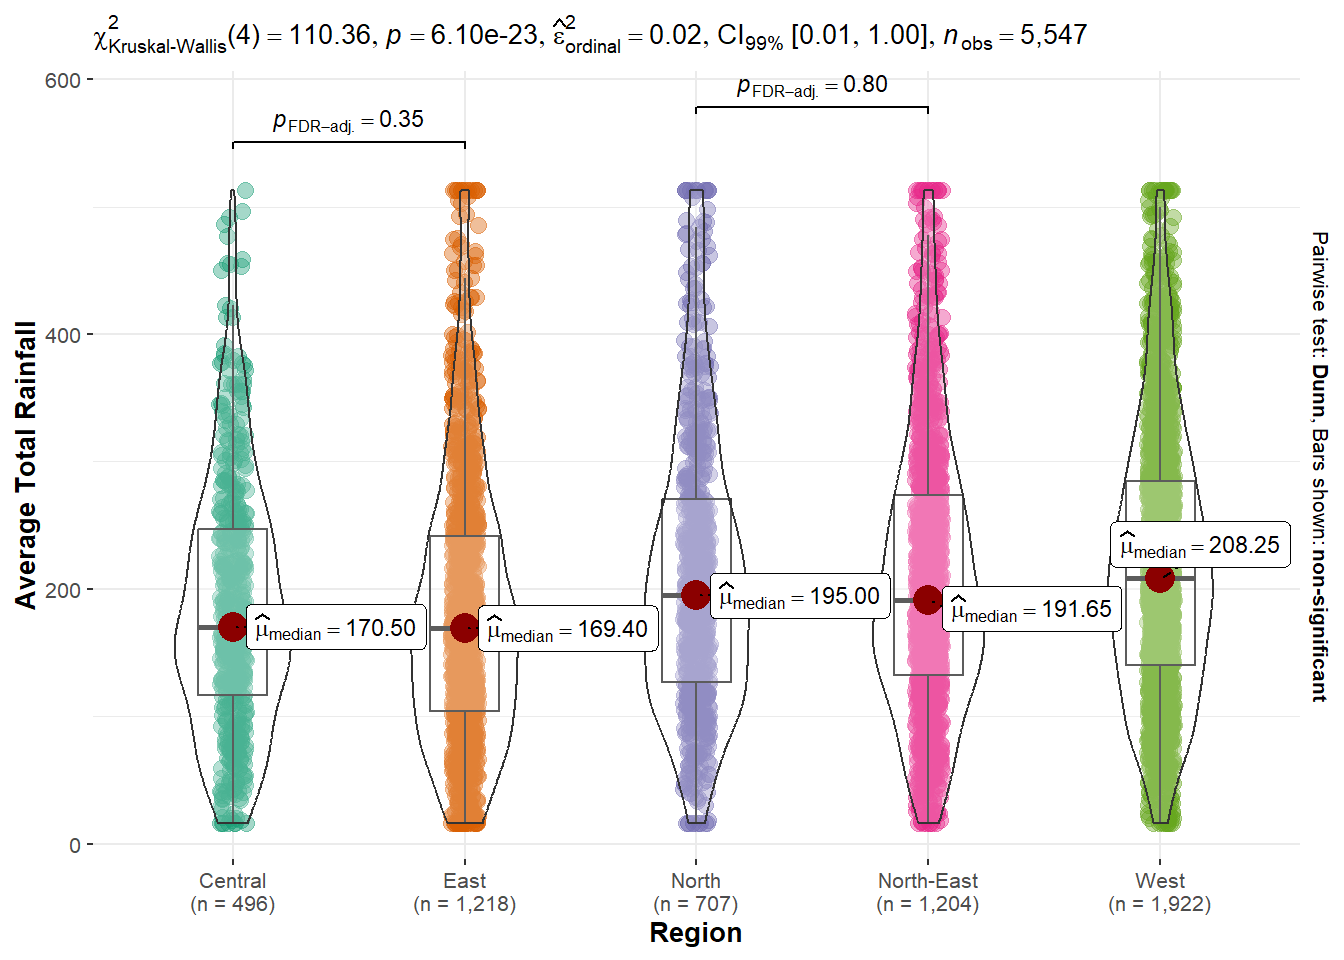
Monthly_Rf_Region(metric = "Avg_Total_Rf60",
                   p_type = "box",
                   t_type = "nonparametric",
                   pair_disp = "non-significant",
                   pair.comp = T,
                   conf = 0.95,
                   nooutliers = T)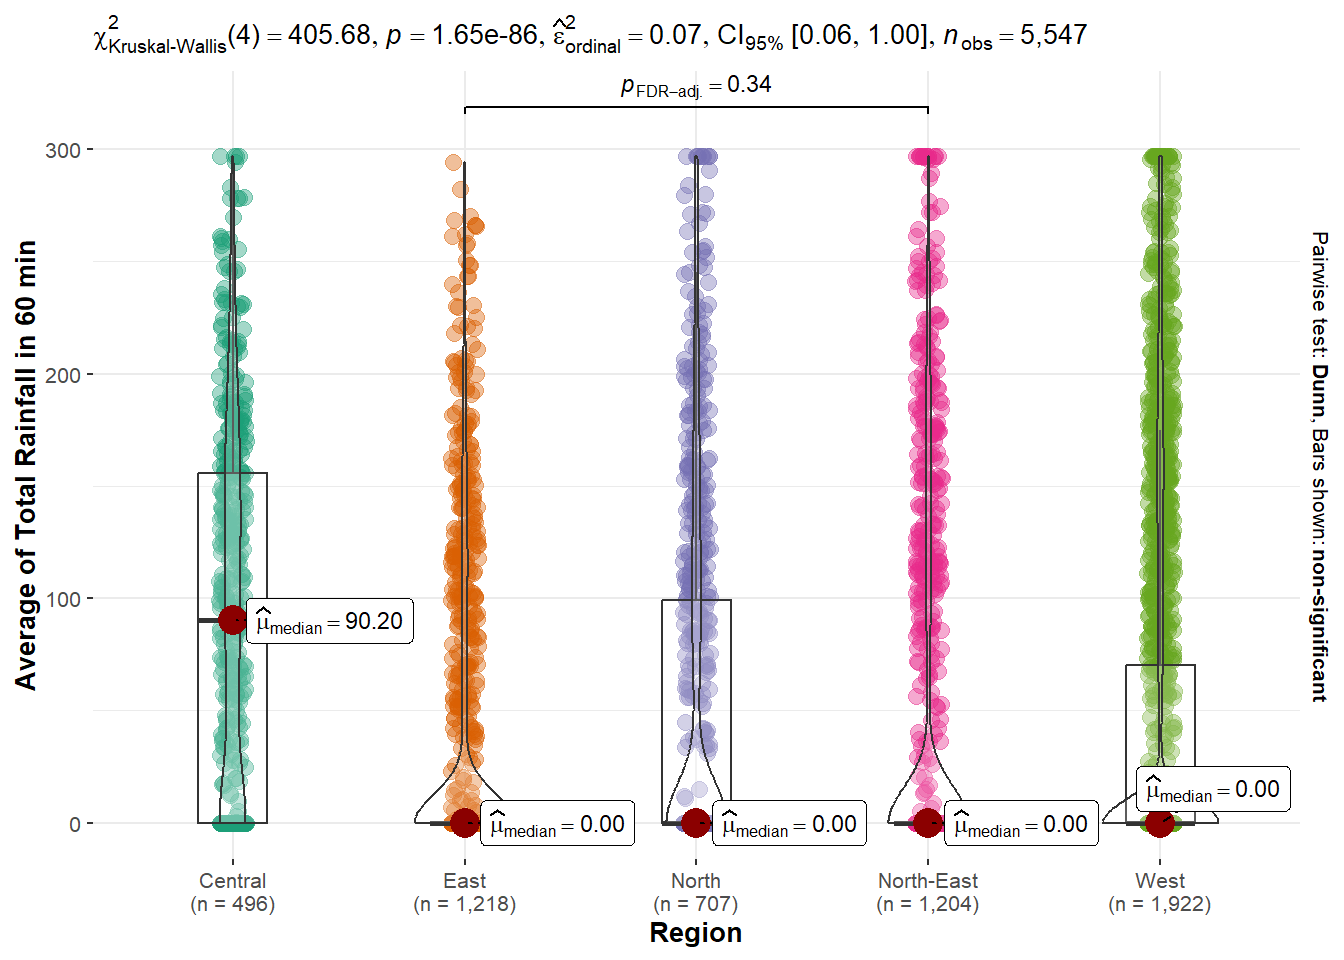
Monthly_Rf_Region(metric = "Max_Total_Rf",
                   p_type = "violin",
                   t_type = "nonparametric",
                   pair_disp = "non-significant",
                   pair.comp = T,
                   conf = 0.99,
                   nooutliers = T)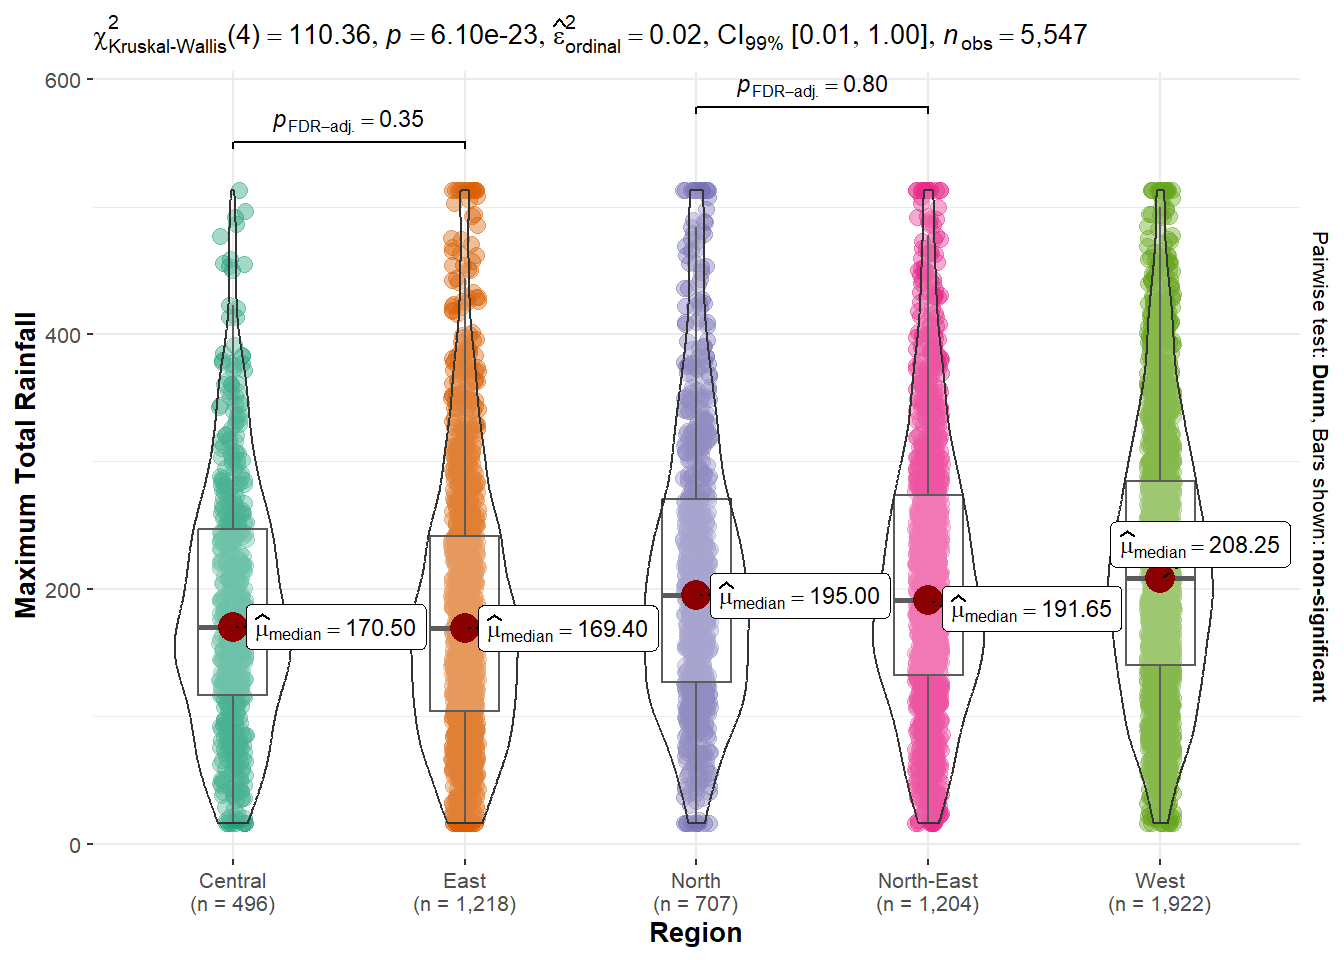
9. Mock-up of UI Design
After submitting the individual assignments, the analysis will be transferred to the group’s Shiny app. Based on the identified parameters available for user input, we envision that the Shiny app will look like the following mock-up: